Run 9 → Convert Dashboard → Event Command Center
Introduction
In this lesson, we'll convert the Issue Template's Dashboard (created in Lesson 8) into your Event Command Center. To do so, you'll need to:
- Change the Name of your Dashboard from Issue to Event Command Center
- Add an Event Controller to your new Event Command Center Dashboard
- Associate (link) your Issues Form with your Events Form so the two work together
- Add Event Markers
- You'll be able to test the updated Forms and Event Command Center Dashboard using your Mobile device
- Read the latest in our Run 9 article →
- If you need practice
- Work through the 'Try it!' checklists in your Sandbox (Thunderhawk Arena)
Try it!
→ on Event Computers
A. Start by reading → About Dashboards, Widgets & Filters (5 min)
B. Then return here and complete this Hands-on Checklist
Hands-on Checklist
- Log into Guard IQ on your Event Computer → Hint ✋
- Open your Thunderhawk Arena sandbox organization → Hint ✋
- Click open your Issues Dashboard and Rename it to Event Command Center → Steps ▶
-
Add an Event Controller widget to the new Event Command Center Dashboard → Steps ▶
-
Configure the Event Controller widget → Steps ▶
- Associate (Link) your Issue Form to your Event Controller → Steps ▶
-
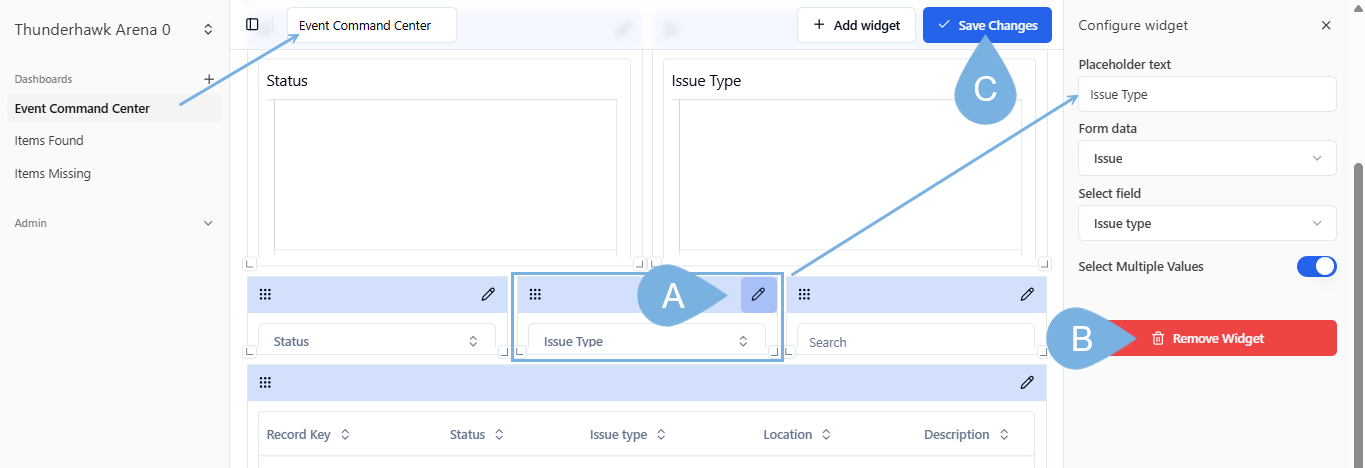
Delete your Issue Type Widget from your Dashboard → Steps ▶
-
It's as simple as A, B, C
-
-
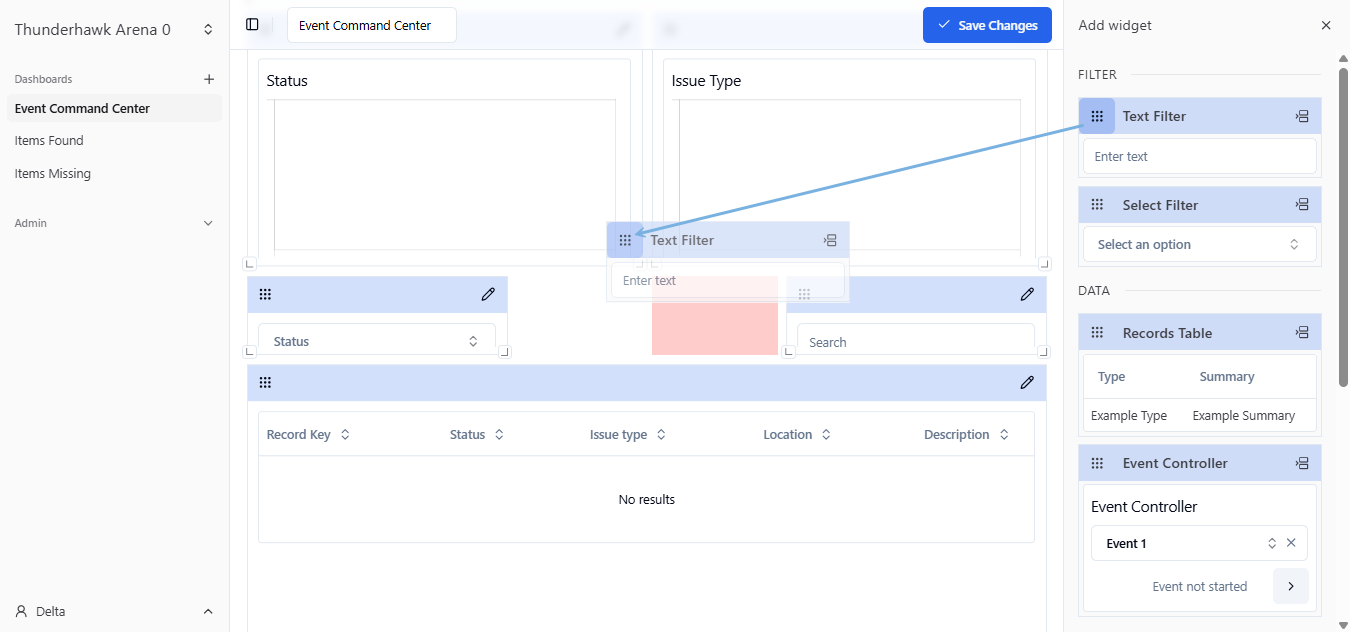
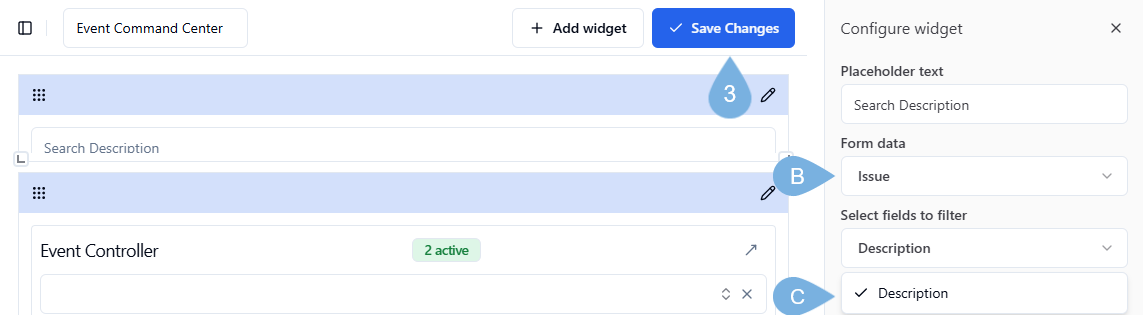
Add a Description filtering Widget to your Dashboard → Steps ▶
- Add a Text Filtering widget → Steps ▶
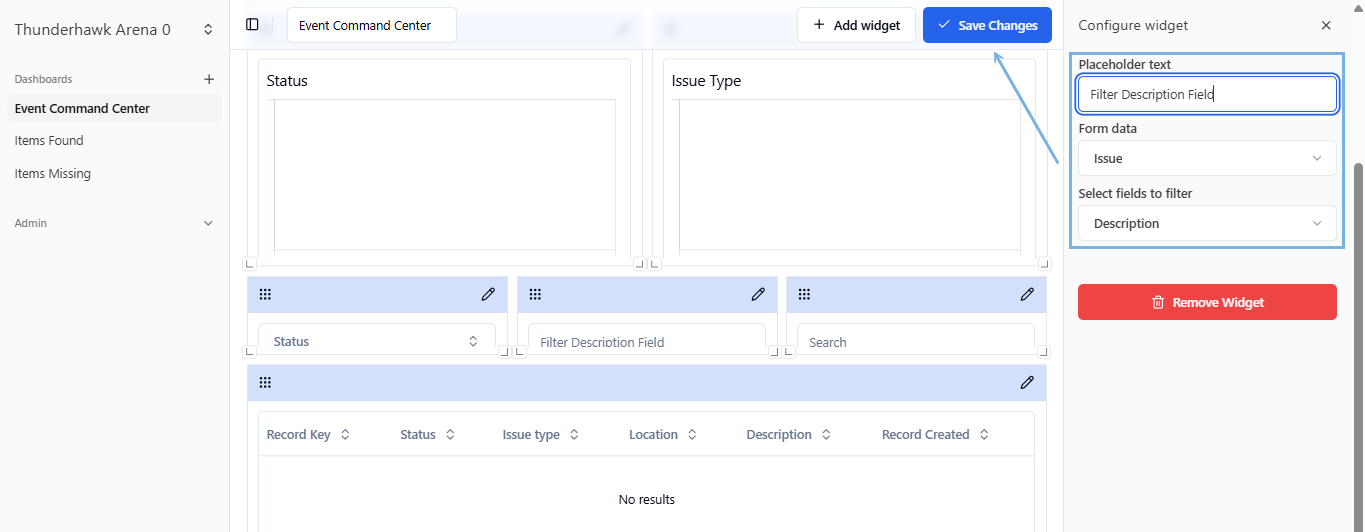
- Name & Configure your new Text Filter
- Placeholder text → Filter Description Field
- Form data → Filter Description Field
- Select fields to filter → Filter Description Field
- Don't forget to ✓ Save Changes!
→ on Mobile Devices or Event Computers
Hands-on Checklist
Add 3 events and 3 Issues
-
Click +Create and open the Event form → Hint✋
-
Add 3 new Events Form → Hint✋
-
Create 3 Records with the Issue Form → Hint✋
- Tie the 3 Issues to one of the Events you entered in Step 2 above
- Include a Description of each of your new events
-
Practice advancing your Event Markers
-
Filter your Dashboard using your new Description text filter
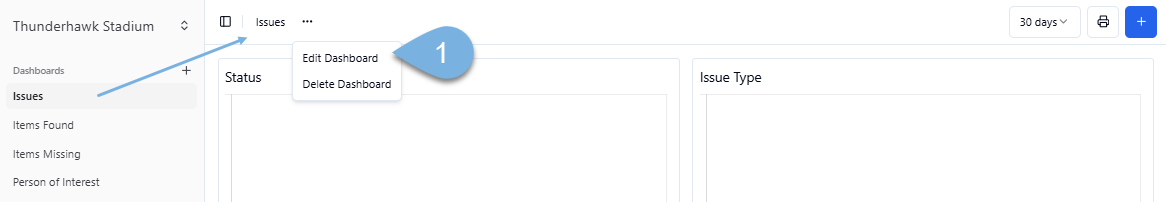
Rename Dashboards & Reports
To rename a Dashboard and its affiliated Report:
-
Open your Dashboard → ex Issue
-
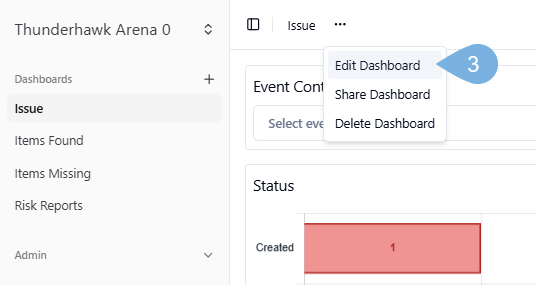
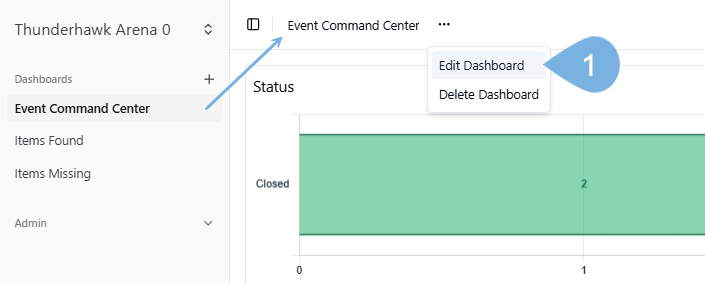
Click the Dashboard editing ellipsis → ( . . . )
-
Pick Edit Dashboard
-
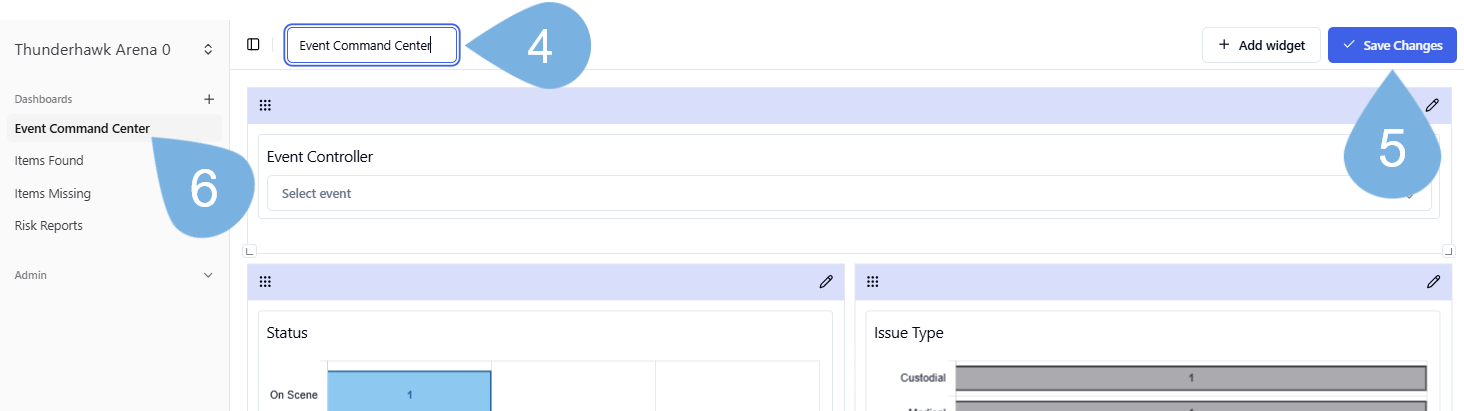
Rename the Dashboard → ex. Event Command Center
-
Click ✓ Save Changes
-
Blink → and the new name will appear in the Navigation bar
About Dashboard Widgets & Filters
Dashboards are organized collections of Widgets for marking events, tracking incidents, dispatching solutions, allocating resources, and providing filtered post-event summaries and risk Reports.
Easily modified and shared, they are the nerve center of your operations.
-
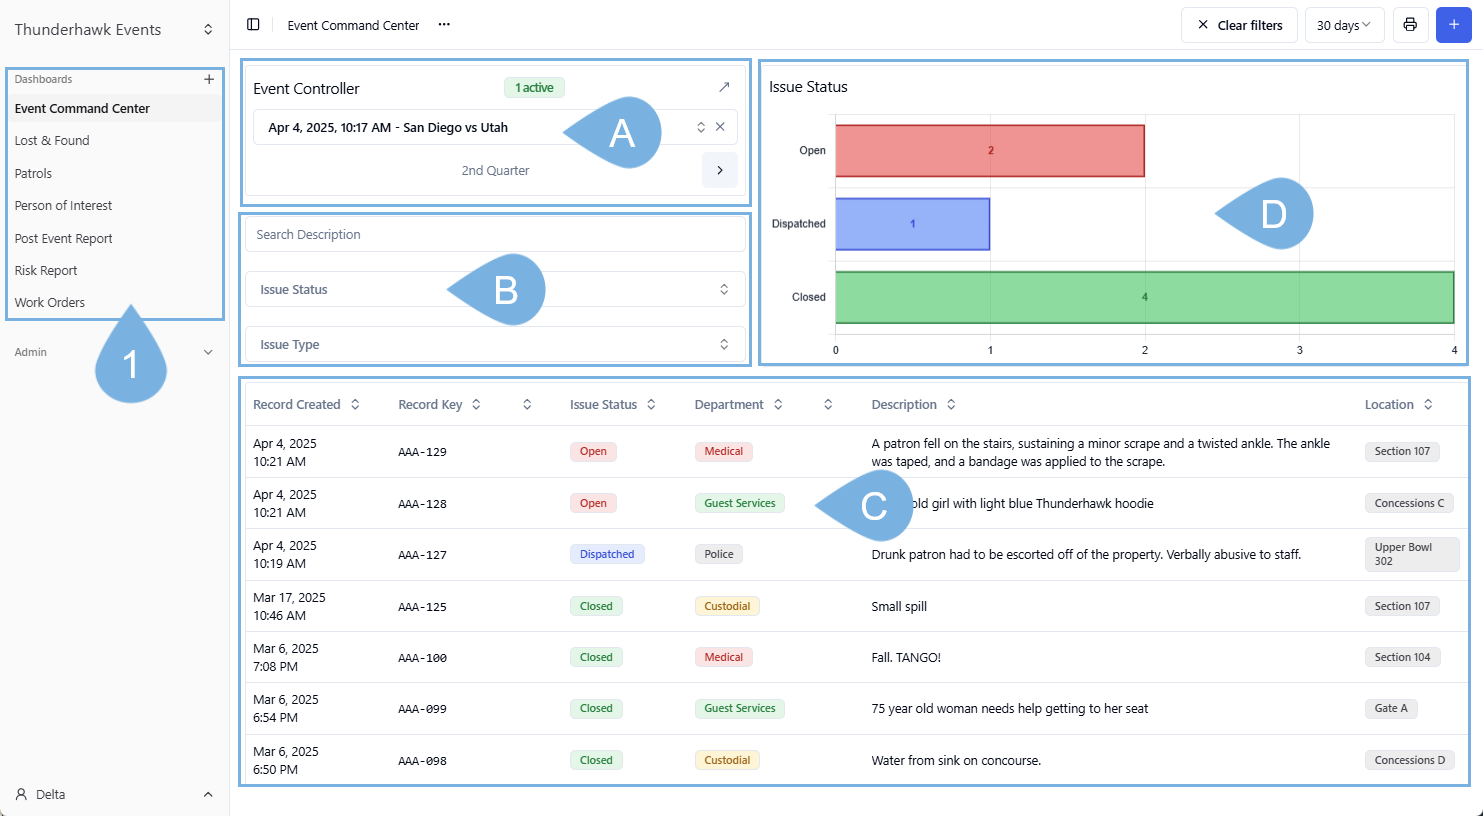
Open your various Dashboards from the Navigation panel
-
As marked above → segment and filter your Dashboard's Records with Widgets! For example:
A. Event Controller → sort Events by Name, Date, and Event Markers
B. Filters → filter by Issue Type, Status, Description, etc.
C. Records Table → segment by Time, persons Dispatched, Progress, Location, Department, etc.
D. Charts → track progress with Charts and Graphs
Leader-level additions to Dashboards
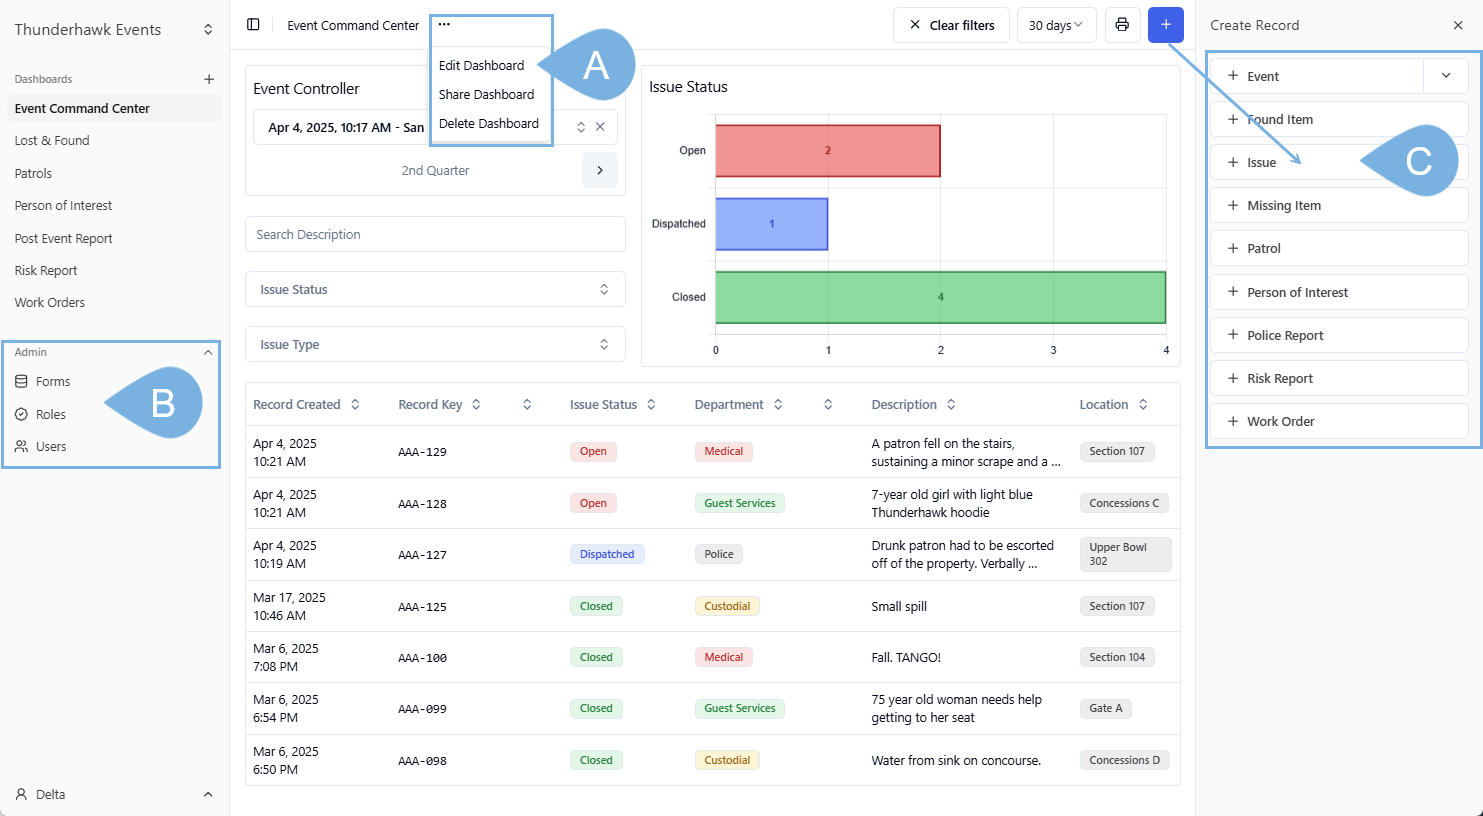
If your organization has given you Leader-level access, you may also see the ellipsis (...) menu to the Editing options and the Admin menu. Even the number of Forms you have access to can changed based upon your Role Definition.
-
As marked above:
A. Editing options → Edit, Share & Delete Dashboards
B. Admin options → Forms, Roles, Users & more depending on the assigned Role
C. Create Records menu → Event, Issue, Lost & Found, Risk, and more depending on the delegated Role
About the Add Widgets Panel
You'll insert and configure your Widgets from the Add Widgets panel. The Panel is divided into three categories → Filter, Data, Chart.
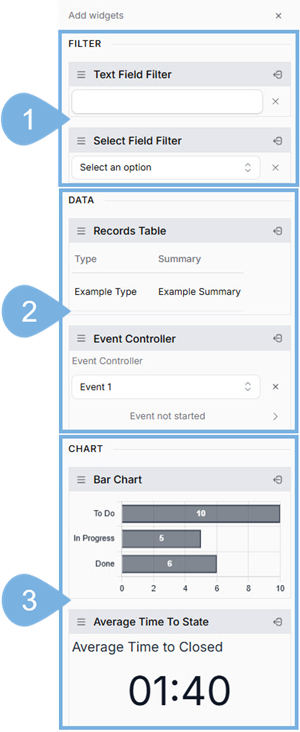
- Filter
- Text Field → Filter the Text Entry fields in your Records
- Select Field → Filter by any drop-down selection made in your Records
- Data
- Records Table → Track any or all of the entry types made for each Record
- Event Controller → Select Events by Date and Name, and track progress with Event Markers
- Chart
- Bar Chart → Add charts to track any drop-down selection and status updates
- Average Time to State → Add to track the time it takes to resolve open issues
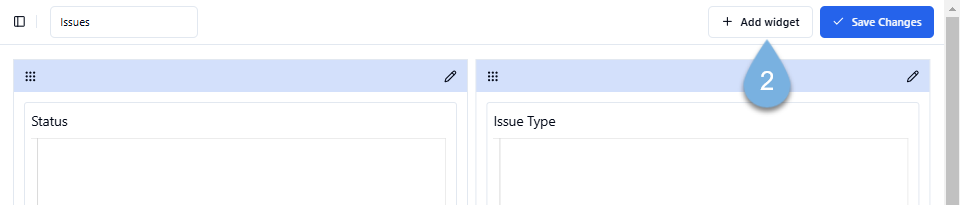
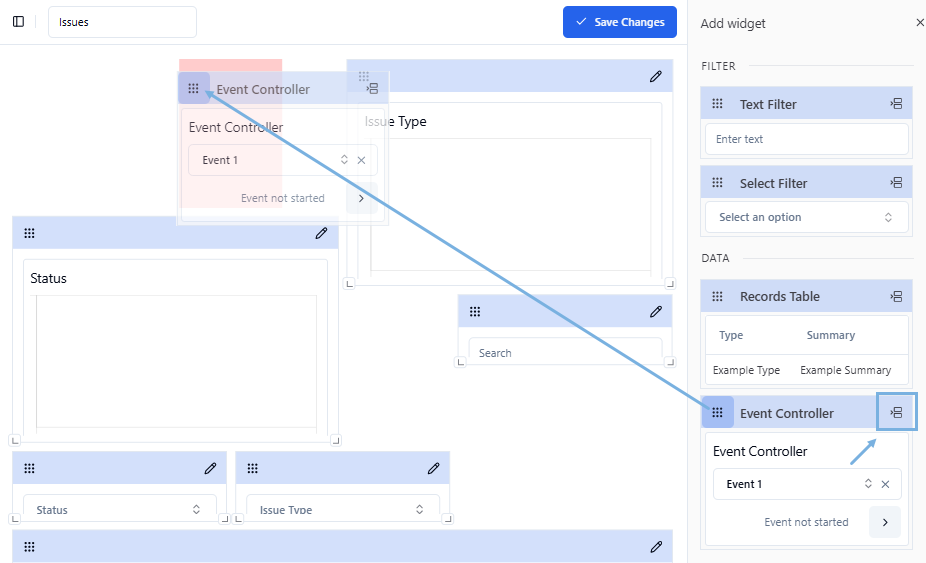
Add an Event Controller Widget with Snag & Drag
To add an Event Controller to your new Event Command Center Dashboard:
-
Open a Dashboard → click the Ellipsis menu → and pick Edit Dashboard
-
Click + Add widget
-
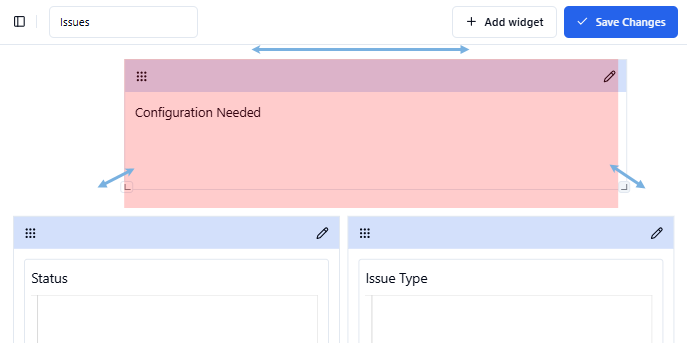
Snag and drag your Widget to the Dashboard → or click the Quick Drop icon to pop in a Widget
-
Position the Widget by dragging its top-bar handle
-
Drag the sizing handles in and out to resize the Widget
-
Jump to the next section to see how to Configure you Widgets, starting with this Event Controller
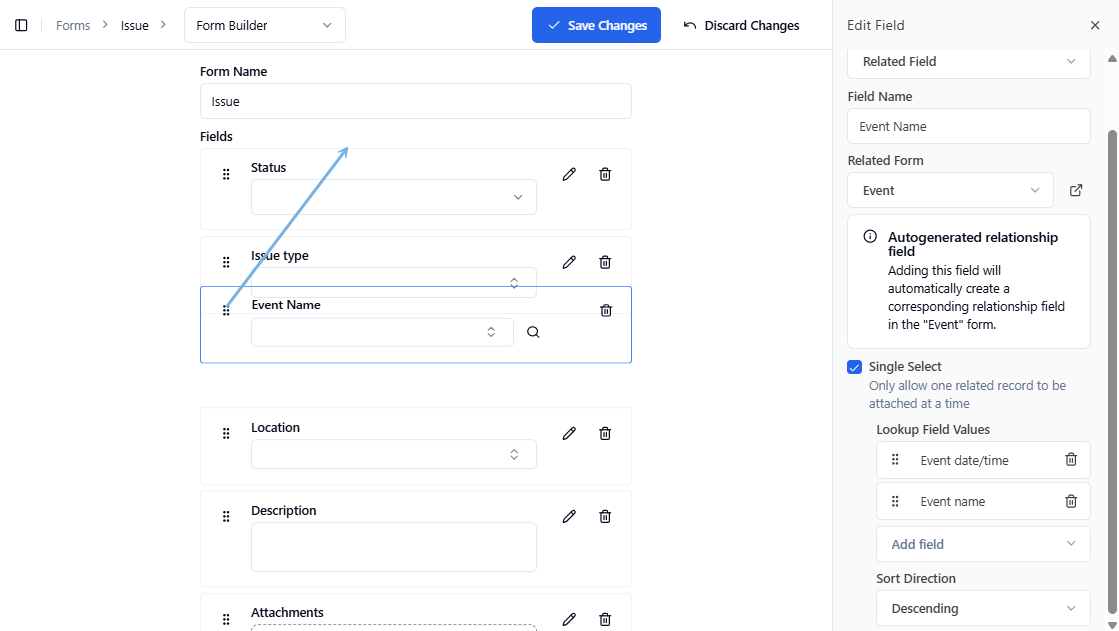
Configure your Event Controller
It's essential that you configure your Event Controller, especially if you have multiple events to track.
-
Open a Dashboard → click the Ellipsis (. . .) → and pick Edit Dashboard
-
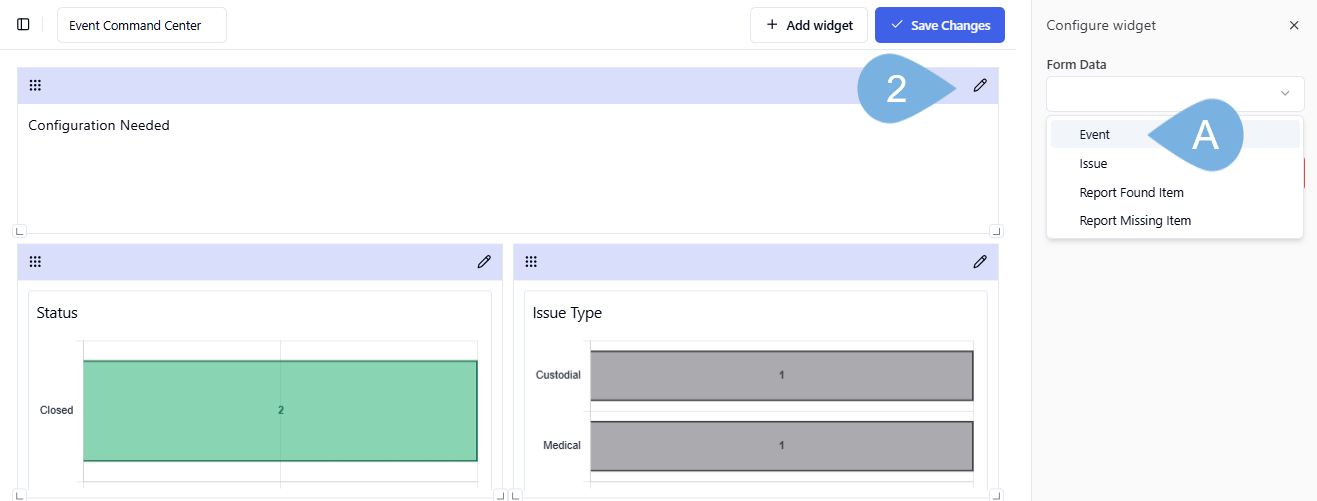
If needed, click the Editing Pencil
-
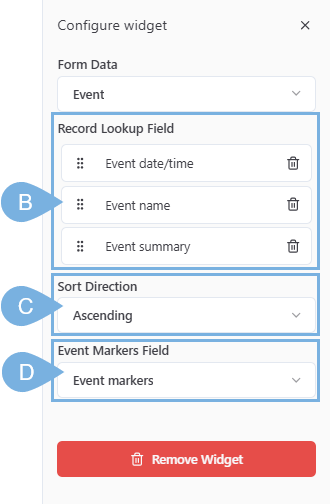
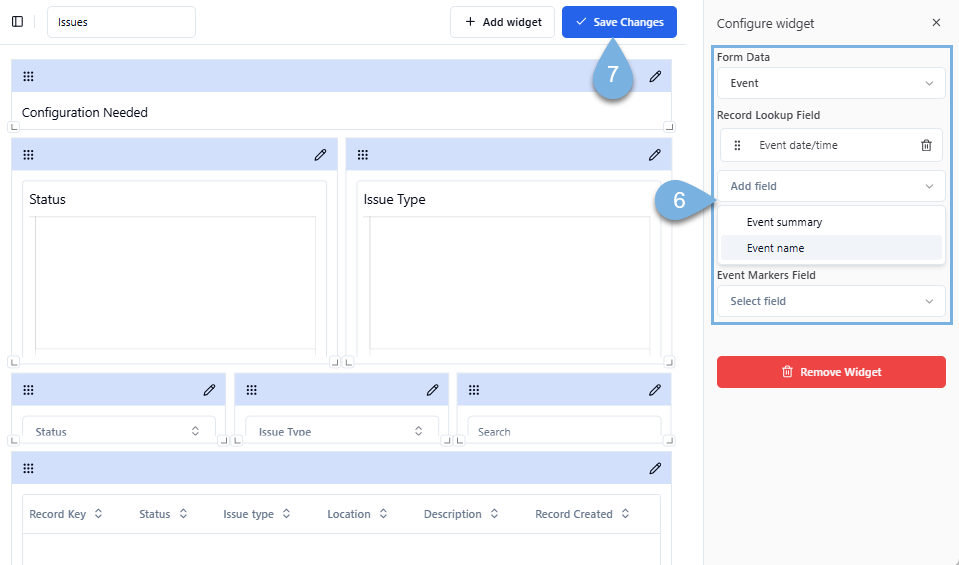
Configure your Event Controller by picking the following:
- A. Form Data → pick Event
- B. Record Lookup Field → select Event date/time, Event name, & Event summary
- C. Sort Direction → _click Ascending if needed
- D. Event Markers Field → click Event Markers if needed
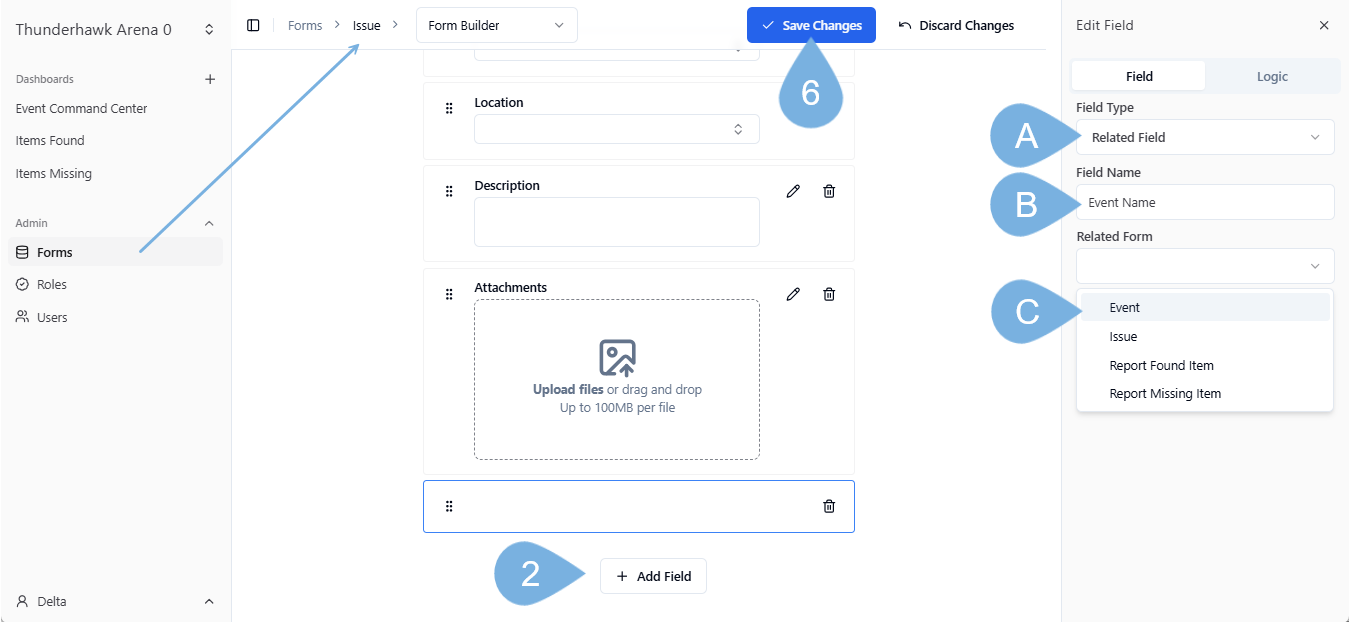
Associate (Link) the Event Controller to your Issue Form
To isolate Issues by their corresponding Events, you need to tie the two together in a neat bow. Doing so will allow your to filter each event separately for post-event analysis:
-
Pick Forms from the Admin tools
-
Pick Add Field
-
In the Edit field panel, choose:
- A. Field Type → select Related Field
- B. Field Name → enter Event Name
- C. Related Form → click Event
-
Move the new Field up from the bottom to the very top by dragging it by its markers
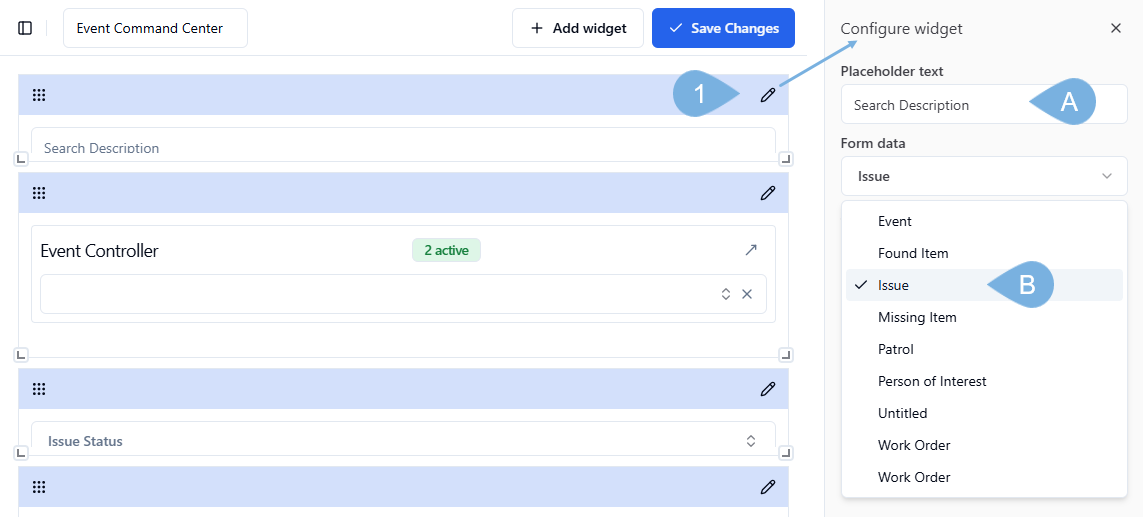
Configuring a Text Field "filtering" Widget
Let's start with an easy one → a Text Field Filter.
-
Select the Edit icon
-
Configure your Widget
-
A. Enter your Placeholder text → ex. Search descriptions
-
B. Link your Text filter Widget to a Form → ex. Issue
-
C. Select which Text Field you want to filter → ex. Description
-
-
Click ✓ Save Changes
Edit or Remove Widgets
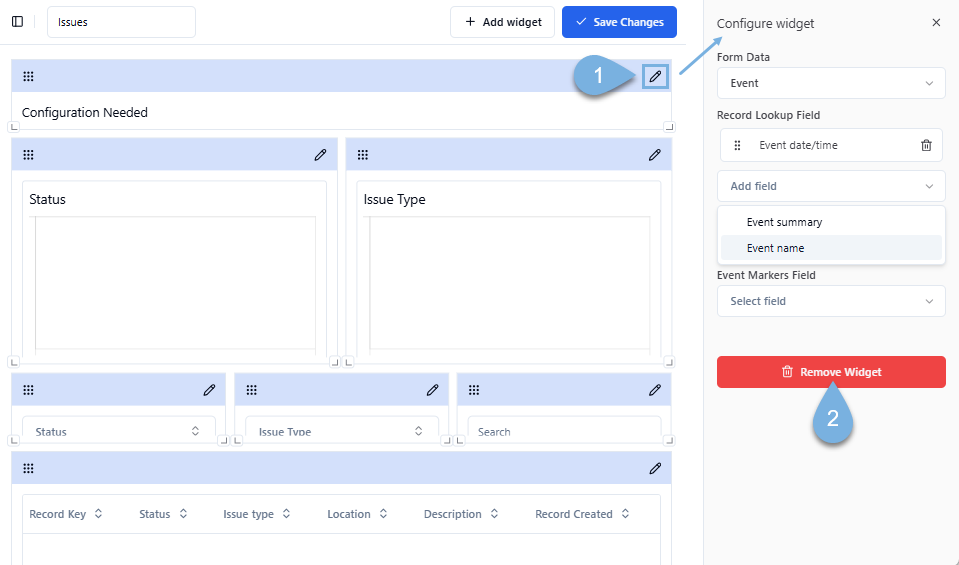
To Edit the configuration of a Widget, or to remove it altogether:
-
Select the Edit icon → make your updates → and click ✓ Save Changes
-
Click Remove Widget
-
Confirm the deletion → by tapping Remove

Share Dashboards by Users or Roles
Dashboard sharing is extremely flexible — empowering you to tailor information access, streamline collaboration, and focus individual Users or Teams on the insights that matter most.
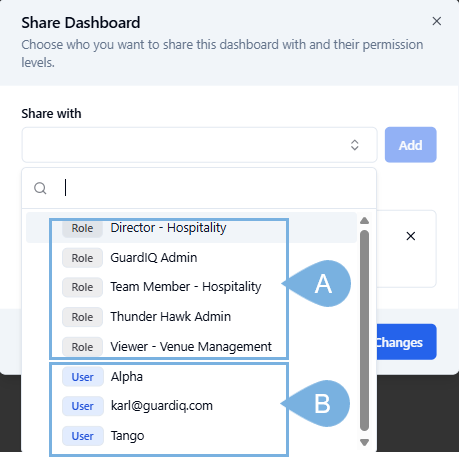
There are two ways to provide Dashboard access:
-
A. Role-based access → assign to teams based on their Role Descriptions
-
B. Private User access → assign to any individual Users in your organization
Designated users can create Private dashboards and effortlessly manage sharing and access permissions. Think of it like Google Docs for your data — create and share precisely with just those who need it.
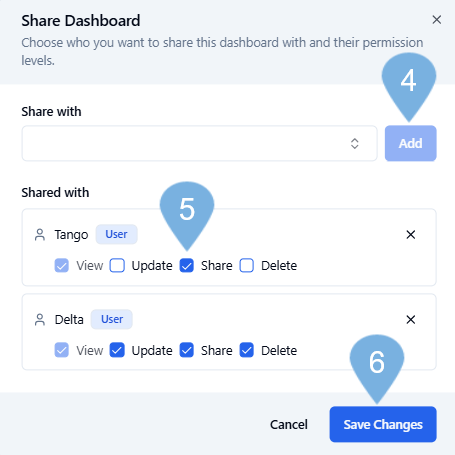
To Share a Dashboard:
-
Open a Dashboard → click the Ellipsis (. . .) → and pick Share Dashboard

-
Open the Share With menu
-
Pick either a Role or an individual User → ex. Tango
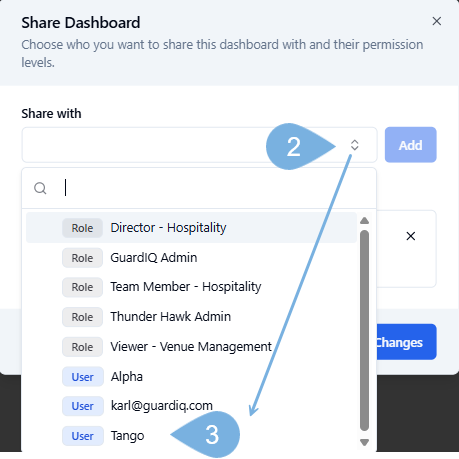
-
Click Add
-
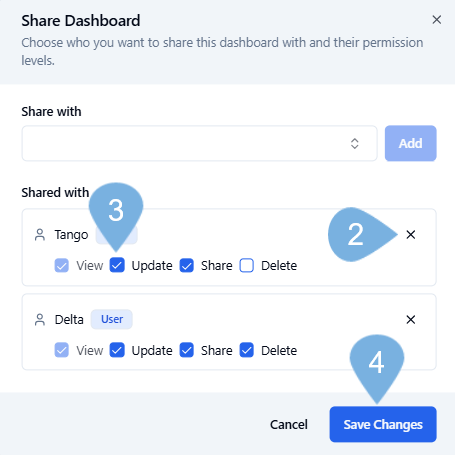
Set Permissions, by checking or unchecking the boxes → ex. Share
-
Click Save Changes
You can only assign permissions at or below the level of your Role Descriptions. If you are a leader, be careful with the permissions you'll allow. Let's look at each. (The '!' estmates the risk):
- View → Allows users to View the assigned Dashboard!
- Update → Permits the editing, additions, and deletions of the Widgets that drive a Dashboard!!!
- Share → Allows individual Users or Role-based Team Members to share a Dashboard!!
- Delete → Permits the individual to remove a Dashboard!!!!

Adding or Removing Permissions to Dashboards
-
Open a Dashboard → click the Ellipsis (. . .) → and pick Share Dashboard
-
Click X to remove an Individual or a Role-based team altogether
-
Check or Uncheck the Permissions you would like to add or remove → ex. Update
-
Click Save Changes