Walk 5 → Filter & Share Reports
Introduction
In this lesson, you'll Filter Dashboards to create any Reports that you wish to share.
While filtering techniques are provided for Mobile devices, you can only generate the PDF reports on your Event Computers at present, so we'll start there!
- Catch up on the latest with our Walk 5 readings →
- About PDF Reports (4 min)
- If you need to practice
- Work through the 'Try it!' checklists in your Sandbox (Thunderhawk Arena)
Try it!
→ on Event Computers
A. Start by reading → About PDF Reports (4 min)
B. Then complete this Hands-on Checklist
Hands-on Checklist
Filter a Dashboard for your Quarterly Report
-
Open Thunderhawk Events and the Event Command Center Dashboard → Hint✋
-
Clear (x) ALL of the filters in the Event Command Center if needed → → Hint✋
-
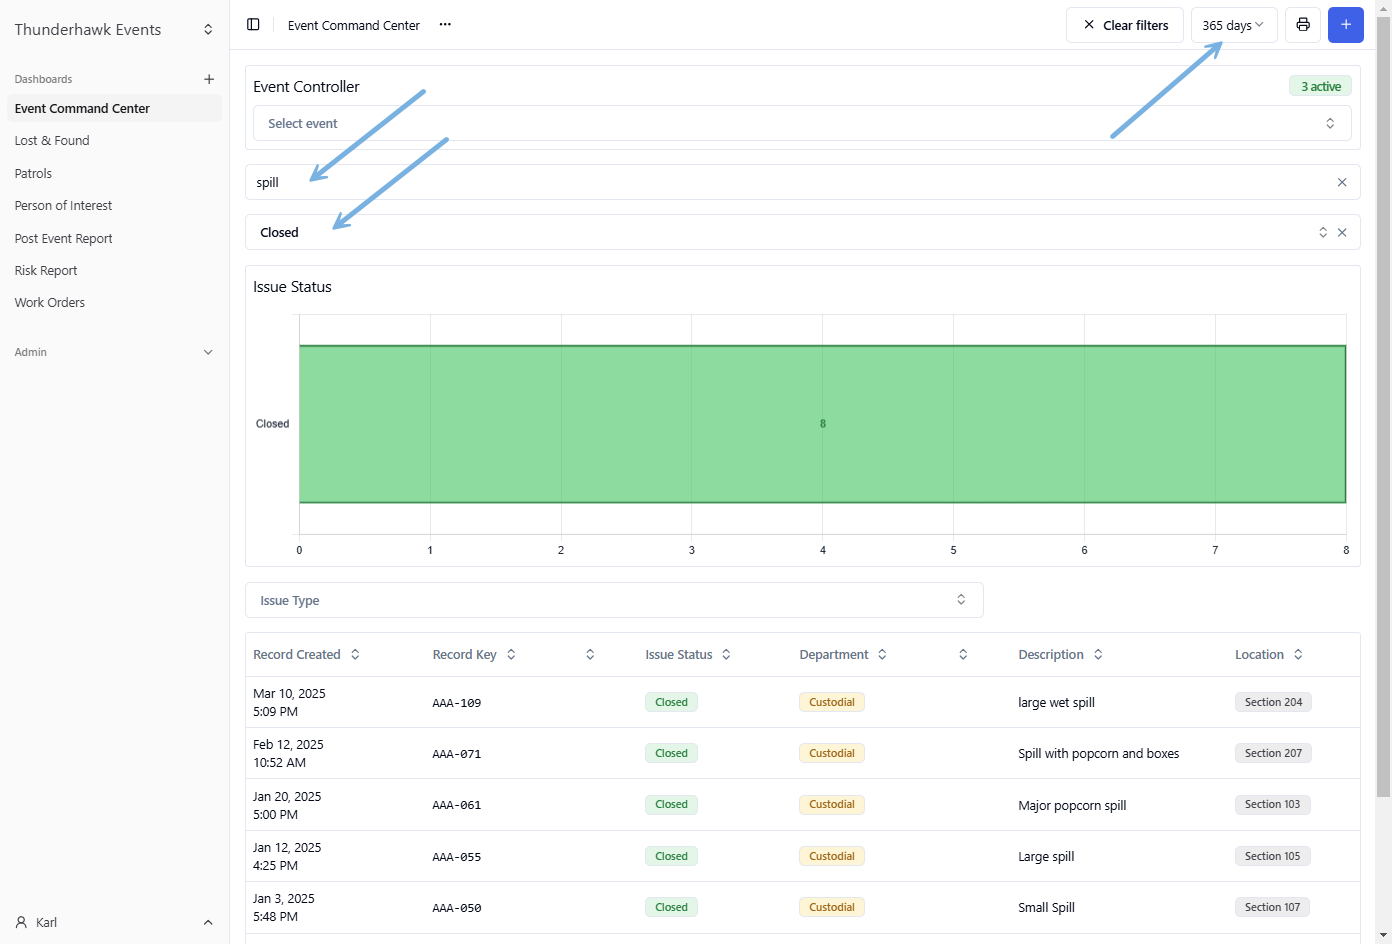
Filter in the following way: → Hint✋
- Set the Date Range filter to 365 Days
- In the Search Description filter → enter spill
- In the Issue Status → pick Closed
Download a PDF Report
-
Having set your filters, Download your PDF report
- Click the Download/Print icon
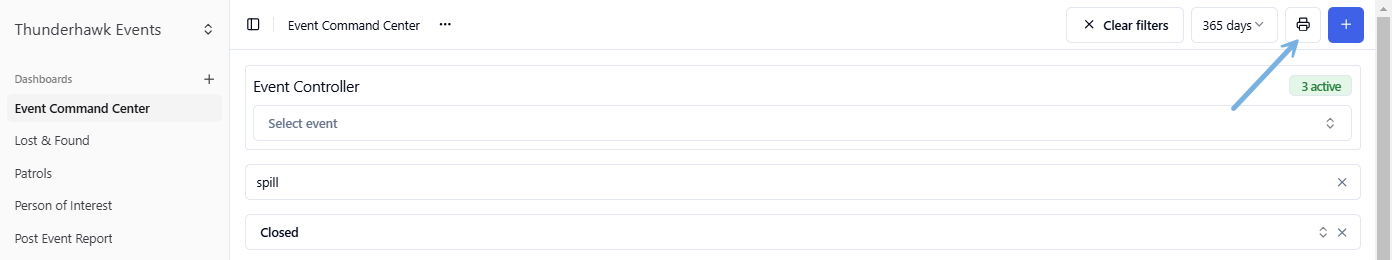
- Choose Landscape followed by Download
-
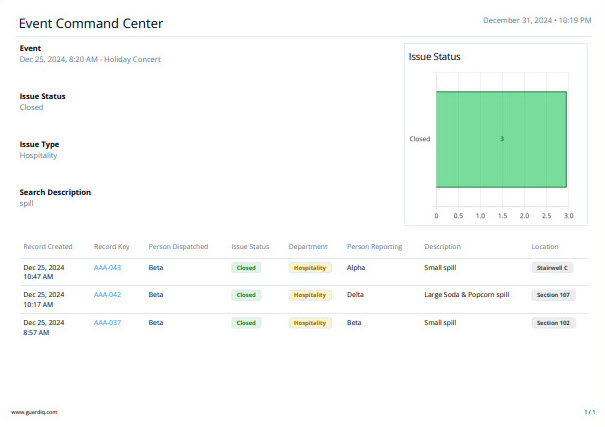
Open your PDF Report from your Event Computer's Download folder
- Inspect your Report -- if necessary repeat steps 1-4 if the Report isn't what you want
-
Share your report!
Open a single Report from the PDF
-
From your PDF, click any Record to open it
-
Print that Record with Control+Print
Print a single Report from the Records Table
-
Return to your Thunderhawk Events and the Event Command Center Dashboard
-
Click any Record to open it
-
Click the Expand icon
-
Print that Record
Summarize your Event → Steps ▶
-
Select the Event you created in Walk 3 and click open the Event's Record
-
Find your Event Summary Field → and click its AI icon
-
Refine your summary by excluding the "Medical issues"
→ on Mobile Devices
- Note: You can only practice the Filtering aspects of this lesson on your Mobile App. Printing PDFs is limited to your Event Computers.
A. Start by reading → Lesson 8: Event Computer Techniques (4 min)
B. Then go through this Hands-on Checklist
Hands-on Checklist
Filter a Dashboard for your Quarterly Report
-
Open Thunderhawk Events and the Event Command Center Dashboard → Hint✋
-
Clear (x) ALL of the filters in the Event Command Center if needed → → Hint✋
-
Filter in the following way: → Hint✋
- Set the Date Range filter to 365 Days
- In the Search Description filter → enter spill
- In the Issue Status → pick Closed
→ in your Home Organization
If you have access to you Home Organization:
- Open your Dashboards and filter the results
- Generate a PDF Report
- Share it with someone!
Event Computer Techniques
About PDF Reports
Adobe created PDFs in the 90s to provide a universal solution for document sharing.
PDFs preserve consistent formatting across devices and in print — making them perfect for Reports!
Design Targeted Reports
Reports are compiled from Widgets that have been built into your Dashboards. Designing and filtering Dashboards will produce the focused Reports you wish to analyze and share!
There are several ways to improve your reports:
-
Filter an existing Dashboard → explained in the next section. (How convenient!)
-
Design a Report-specific Dashboard → as explained in our guide, Design Dashboards & Reports
-
Tweak your Widgets → also found in our guide, Design Dashboards & Reports
Use Case — Filter your Reports
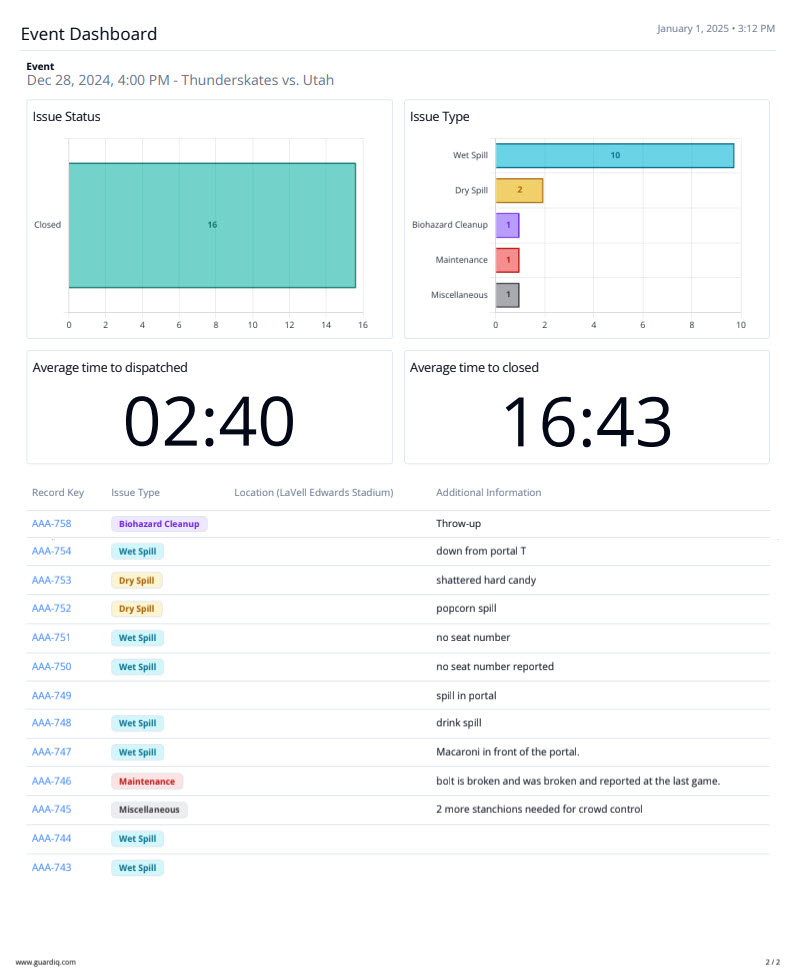
Some Widgets allow data filtering, which is ideal for creating targeted reports. This is demonstrated in the following case study:
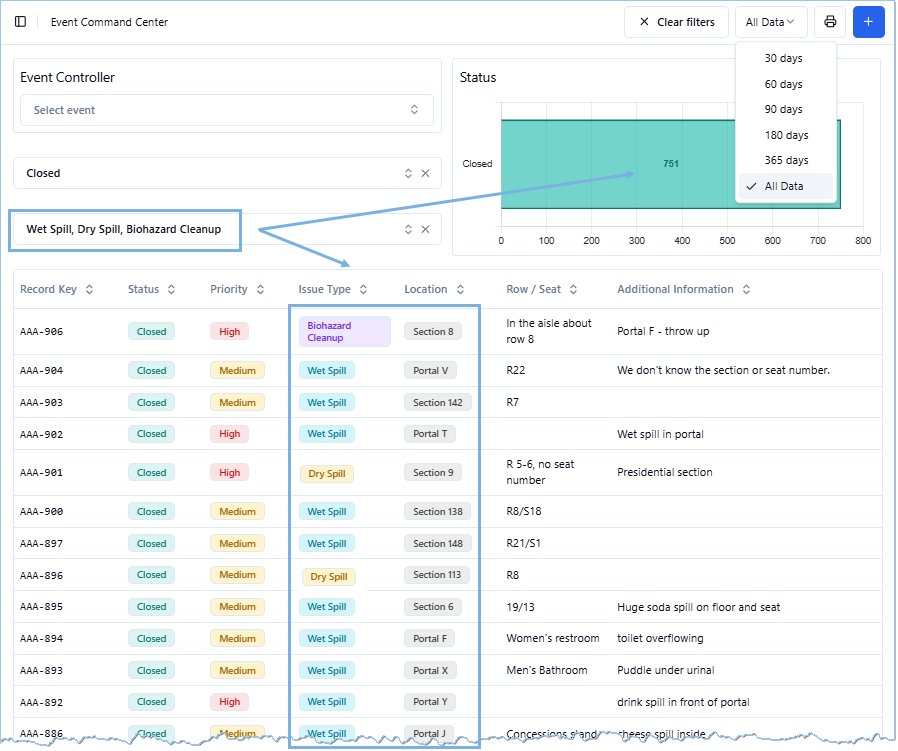
- Ward needed a report detailing the Custodial team's response to Wet Spills, Dry Spills, and Bio-spills
- By filtering the report, he generated a view specific to the Custodial Team, showing spill frequency, completion times, and locations
- Ward initially assumed most spills occurred in the end zone bench seats (due to the lack of cupholders)
- However, filtering over 751 records revealed a near-equal number of spills in the chair seats, disproving the assumption
- This data prompted a reallocation of staff pre-positioning
- Combined with a streamlined communication system, improved prioritization, and clear accountability, the venue achieved a 71% reduction in spill response time
- Ward and the team are now exploring further improvements
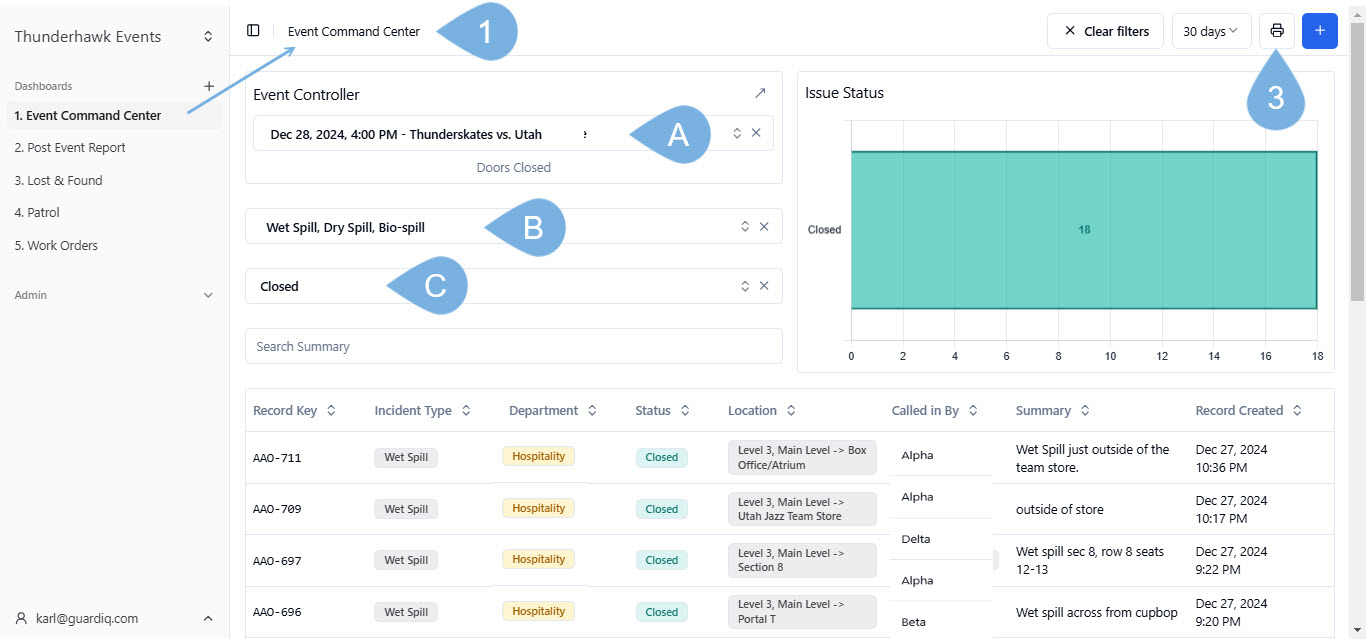
To create a filtered Report → and track the status of Ward's incessant "Spill" issues:
-
Open a target Dashboard → ex. Event Command Center
-
Filter your Records by:
A. Selecting an Event to filter from your Event Controller → Optional
B. Pick single or multiple Filters from your Selection lists → ex. Wet spill, Dry Spill, Bio-spill, etc.
C. Apply single or multiple Status filters → ex. Reported, Dispatched, Closed
-
Click the Print/download button to start downloading! See the next section
Download your PDF Reports
Any Dashboard can be turned into a Report with a few clicks:
-
Select a Dashboard
-
Optional: Customize your Report by filtering the Dashboard → see Filtering Dashboard Reports
-
Click the Print/Download button

-
Select Portrait or Landscape
-
Click Download

Share your Reports
To share a Report:
- Locate your PDF in your Downloads folder
- It will have the same name as your Dashboard → ex. Event Command Center
- Rename the PDF Report if you wish
- Share your Report via email, social media, chat, Zoom, Teams, Slack, etc.
- Print your PDF for stakeholders
:::
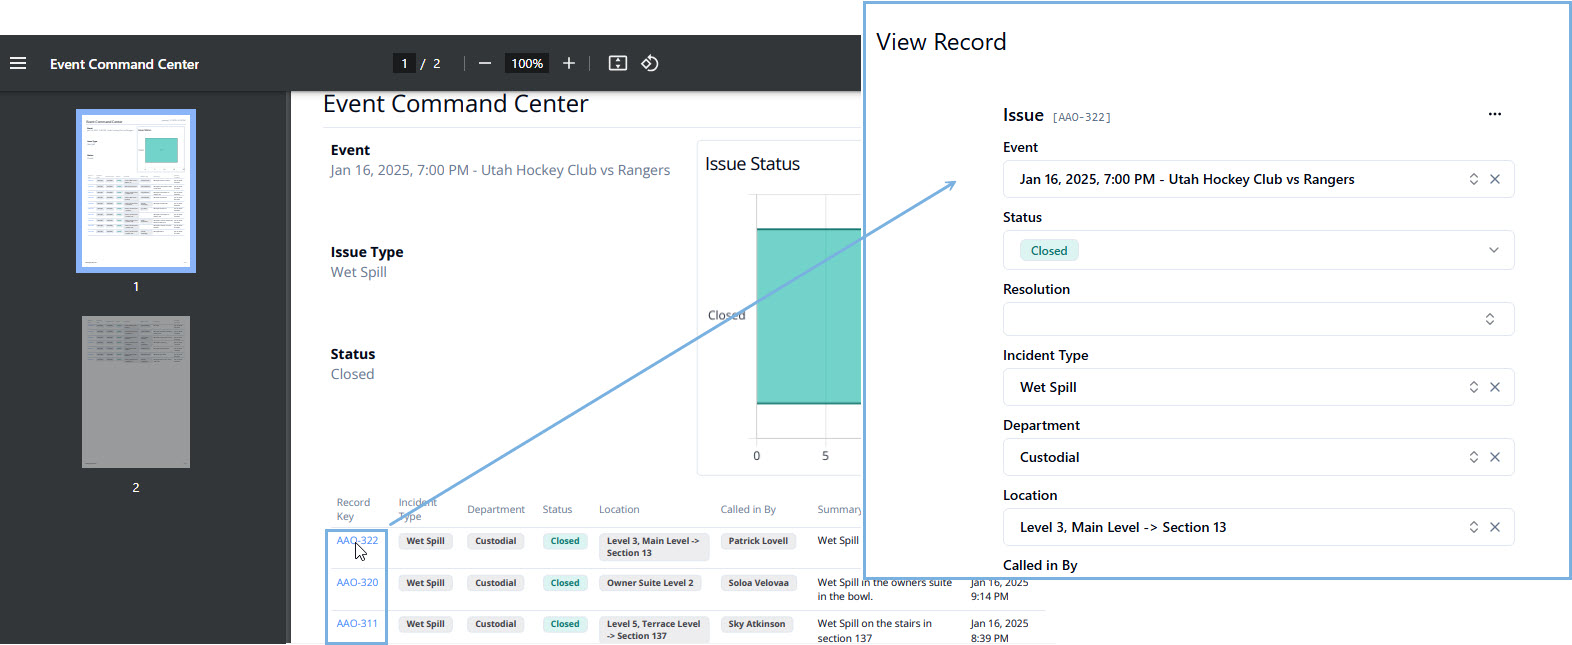
Open individual Records directly from your PDF Reports
- If you have a question about a specific Record, click its Record Key on any PDF Report
- Record Keys are alphanumeric identifiers → ex. AAG-731
- The Record will pop open so you can examine it in isolation
- This capability is handy for stakeholders who must review specific incidents → ex. the Records found in Risk Reports
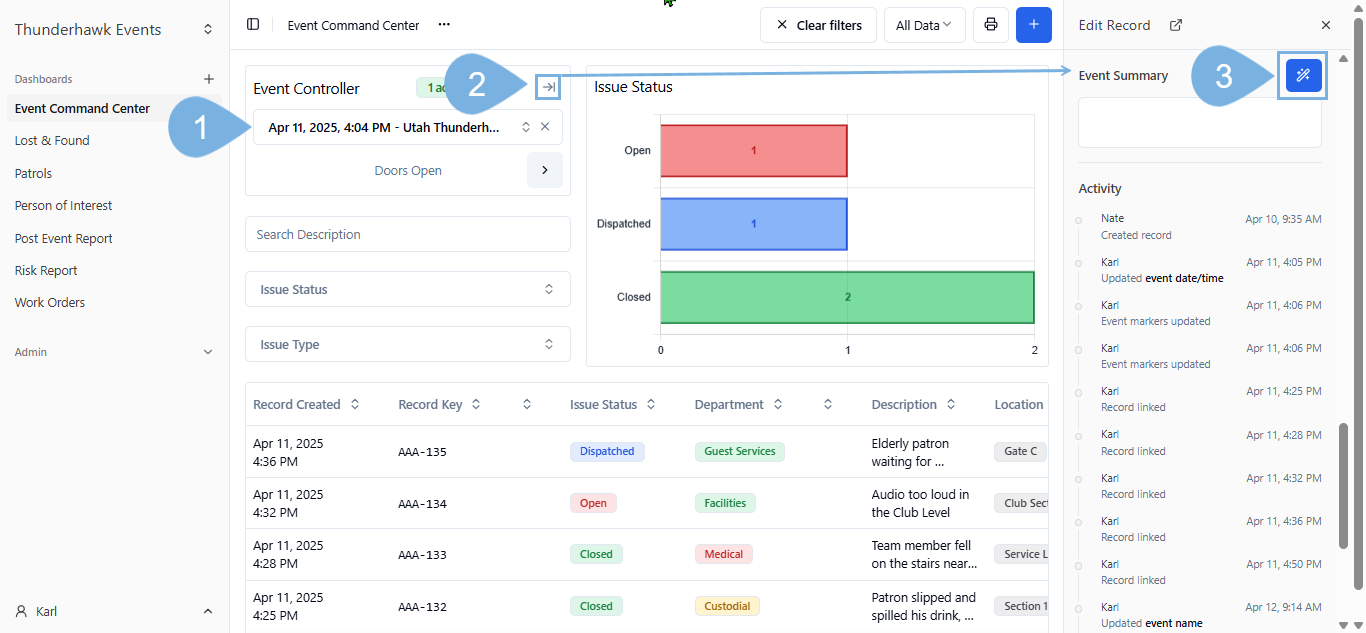
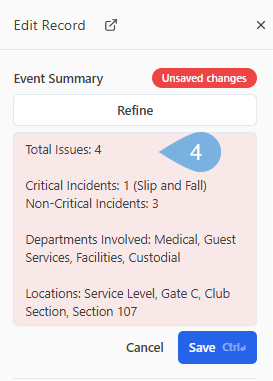
NEW → Summarize an Event with AI
To generate and refine a summary of your event:
-
Select an Event from your Event Controller
-
Click the open the Event's Record
-
Find your Summary Field → and click its AI icon
-
Blink as your event's Records are summarized
-
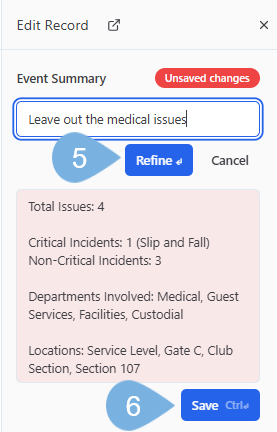
Improve and focus your summary by adding or excluding information → ex. "Leave out the Medical issues" → then click Refine
-
Continue refining until you are satisfied → then click Save
-
Copy and paste your summary from it's window → then place it anywhere you like

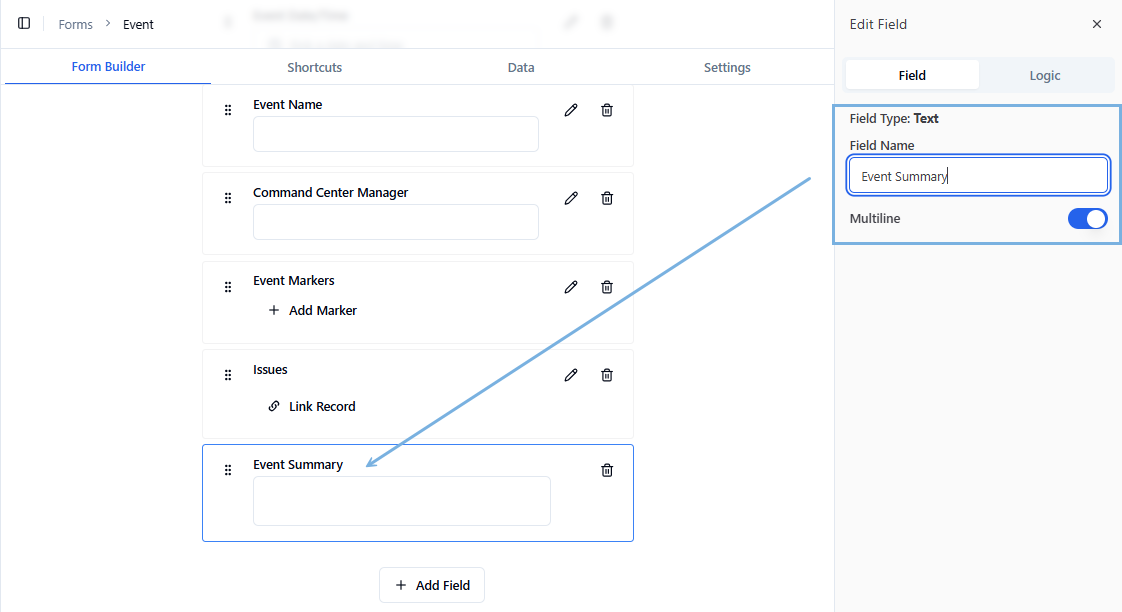
- The name of the Event Summary Field can vary
- However, it must be a Multiline Text Field
- And, the Form must have have one or more Linked Records attached
- If you have questions, ask your Guard IQ Admin for help setting up your AI Summaries
End of Reading