→ Filter & Share Dashboard Reports
Share Dashboards & Reports by Users or Roles
Dashboard sharing is extremely flexible — empowering you to tailor information access, streamline collaboration, and focus individual Users or Teams on the insights that matter most.
There are two ways to provide Dashboard access:
-
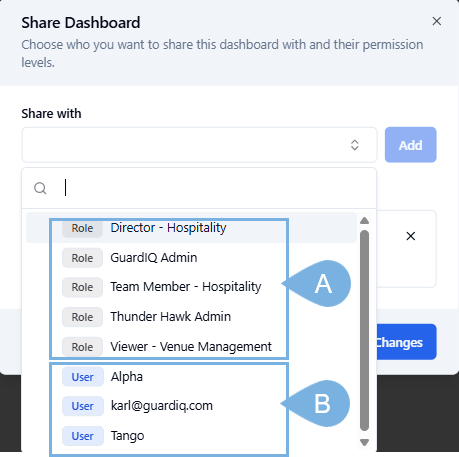
A. Role-based access → assign to teams based on their Role Descriptions
-
B. Private User access → assign to any individual Users in your organization
Designated users can create Private dashboards and effortlessly manage sharing and access permissions. Think of it like Google Docs for your data — create and share precisely with just those who need it.
To Share a Dashboard:
-
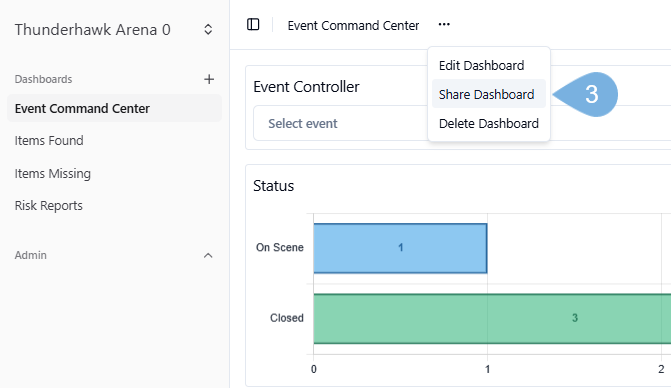
Open a Dashboard → click the Ellipsis (. . .) → and pick Share Dashboard
-
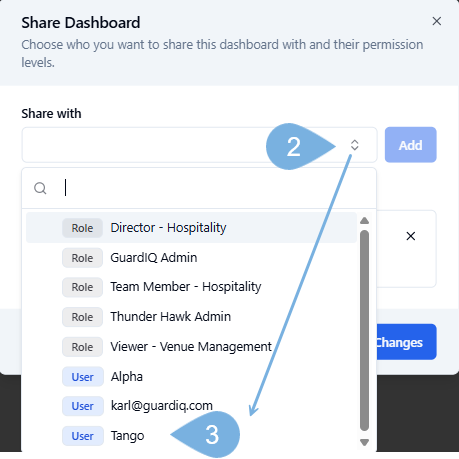
Open the Share With menu
-
Pick either a Role or an individual User → ex. Tango
-
Click Add
-
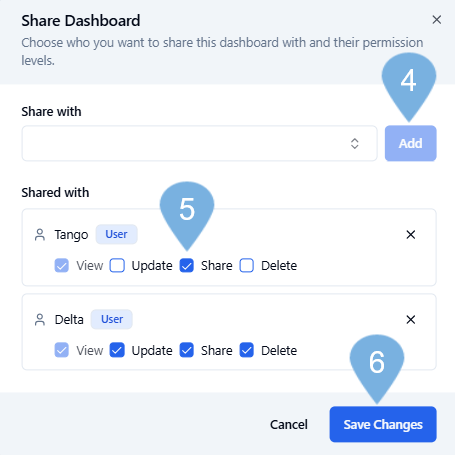
Set Permissions, by checking or unchecking the boxes → ex. Share
-
Click Save Changes
You can only assign permissions at or below the level of your Role Descriptions. If you are a leader, be careful with the permissions you'll allow. Let's look at each. (The '!' estmates the risk):
- View → Allows users to View the assigned Dashboard!
- Update → Permits the editing, additions, and deletions of the Widgets that drive a Dashboard!!!
- Share → Allows individual Users or Role-based Team Members to share a Dashboard!!
- Delete → Permits the individual to remove a Dashboard!!!!

Adding or Removing Permissions to Dashboards
-
Open a Dashboard → click the Ellipsis (. . .) → and pick Share Dashboard

-
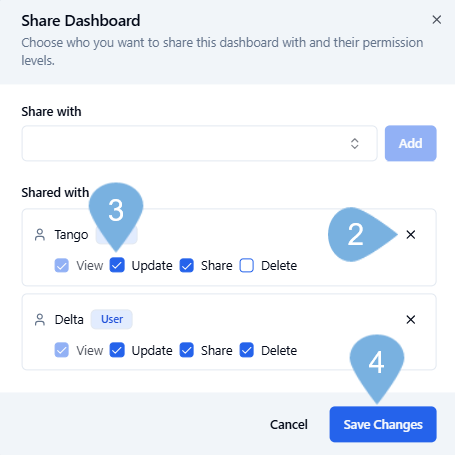
Click X to remove an Individual or a Role-based team altogether
-
Check or Uncheck the Permissions you would like to add or remove → ex. Update
-
Click Save Changes
Creating Real-Time Dashboards & Reports
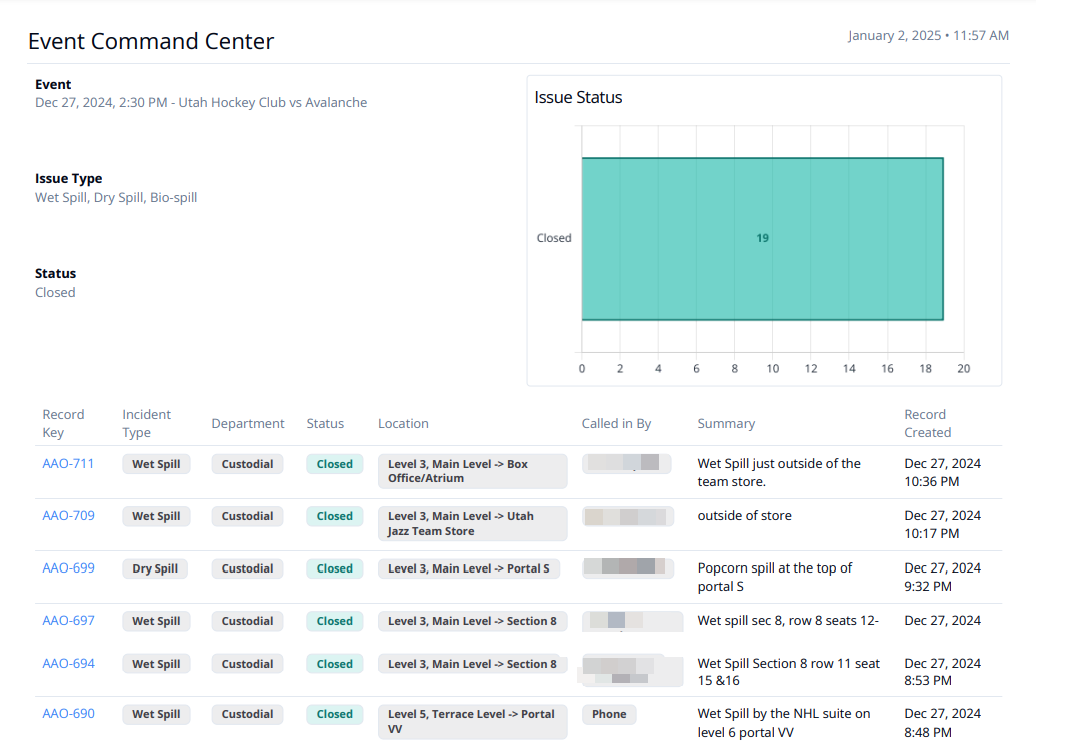
In real time, Dashboards capture what’s happening across your venue — including your security, housekeeping, medical, maintenance, and fan-related issues.
By designing and filtering your Dashboards, you can capture just the information you require to make a full accounting of your Events, team performance, and the health of your Venue.
In this report, the Venue is just looking at spills, Wet, Dry, and Bio.
Visit our Quickstart article Filter & Publish Reports to learn more.
- Reports come directly from the Widgets, Filters, and options built into your Dashboards.- There are several of ways to go about customizing focused, targeted reports:
- Design a Report specific Dashboard → carefully design of the Dashboards and widgets you wish to use for your report. → ex. Event Command Center, Post Event Report, Lost & Found, Patrol, Work Orders, etc.
- Pick Widgets can can Filter in the ways you wish to segment the data → ex. Event, Issue Status, Department (Hospitality), Description, etc.
- Plan the display in your Records Table → ex. Date Created, Record Key, Dispatched, Issue Status, Department, etc.
Need ideas? A look at common Dashboards & Reports
Let's take a look at the Dashboard used by Thunderhawk Events:
-
Event Command Center → click for instructions
-
Post Event Report → click for instructions
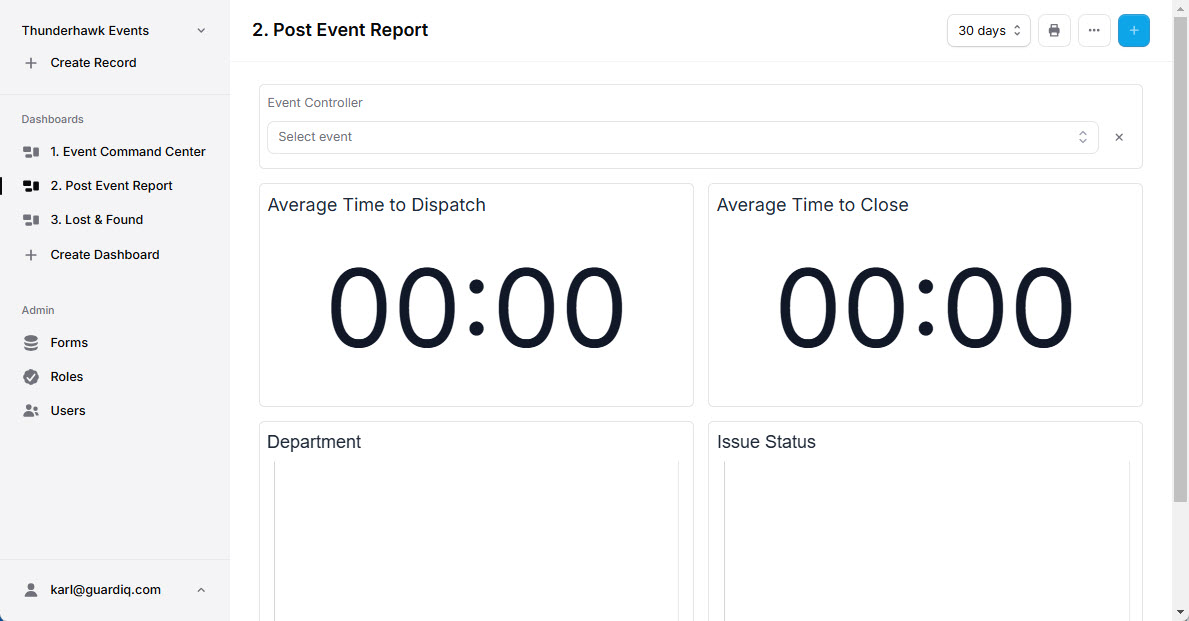
-
Lost & Found → click for instructions
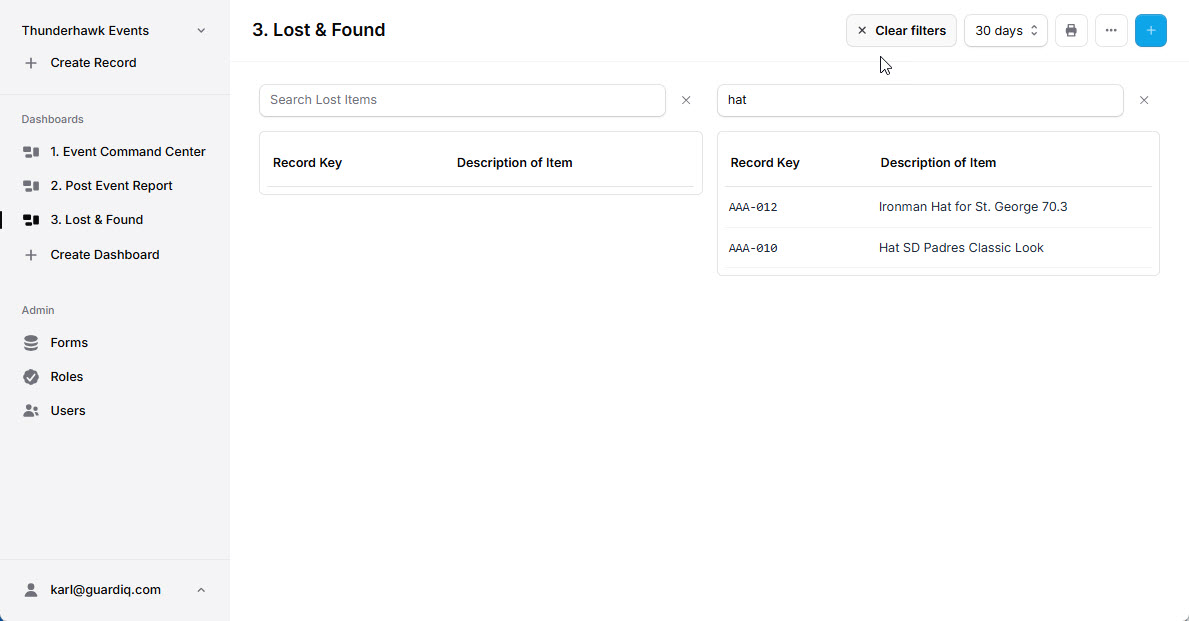
-
Patrol → click for instructions
Converting the Issue Template into an Event Command Center
Using Guard IQ templates?
Your Event Command Center is almost ready — just merge your Event Controller with your Issue Form and Dashboard.
To build an Event Command Center dashboard from the Issue Template:
-
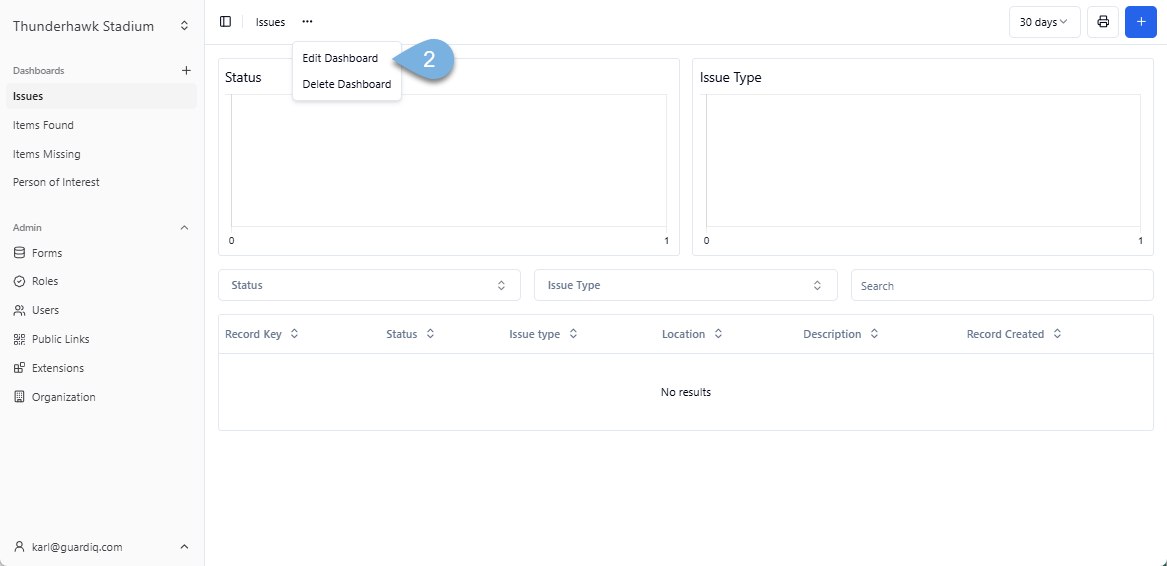
Open your Issue Dashboard
-
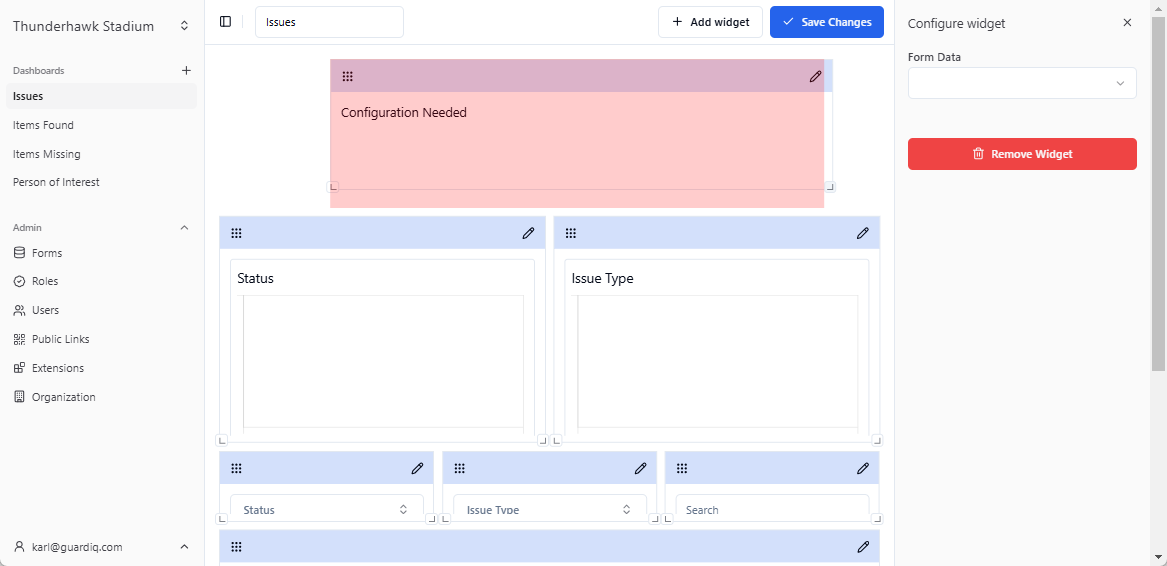
Click the Ellipsis menu → and pick Edit Dashboard
-
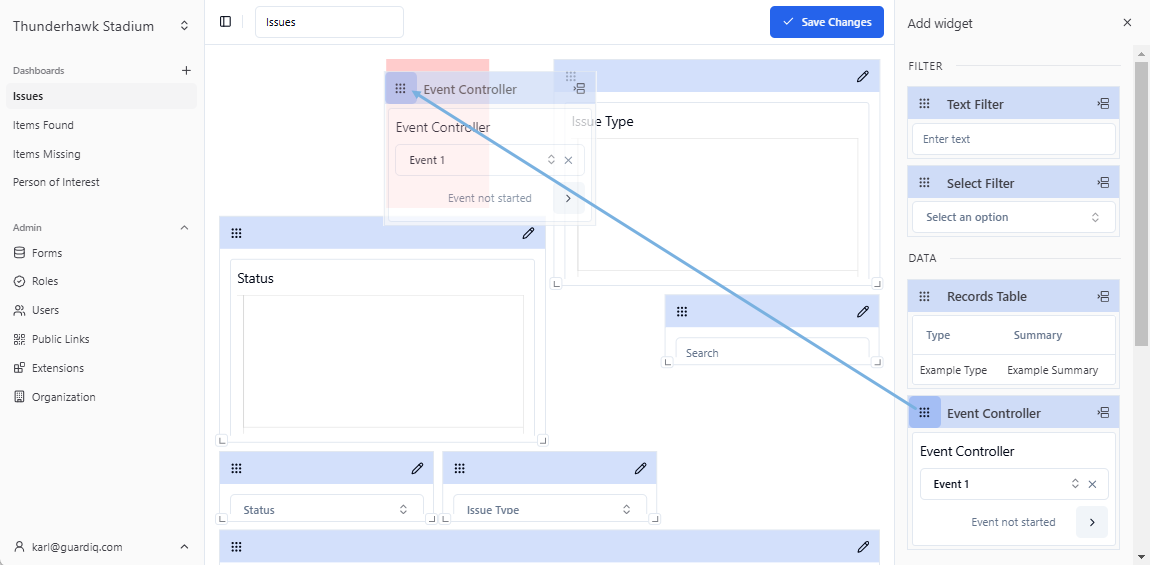
Click + Add widget
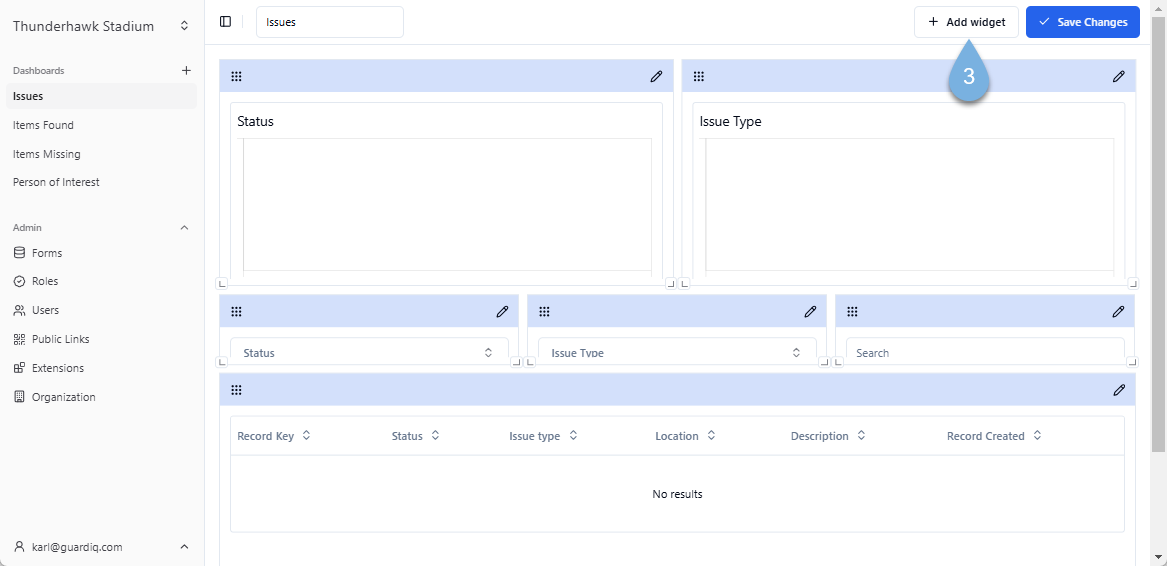
-
Snag and drag the Event Controller widget to the top of the Dashboard → or click the quick add shortcut icon
-
Position the Event Controller near the top of the Dashboard -- drag the markers to make it wider or narrow -- grab the header to move it around
-
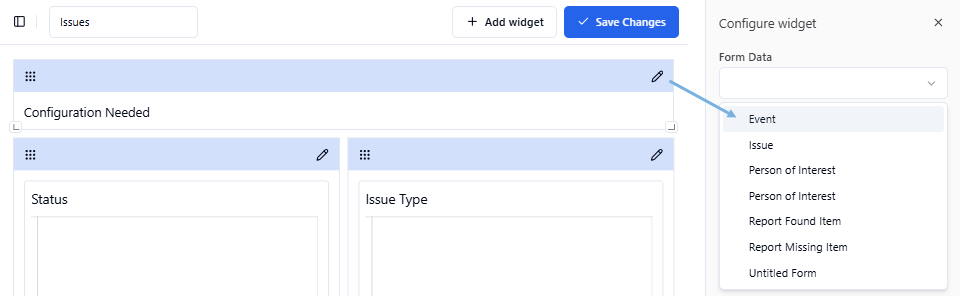
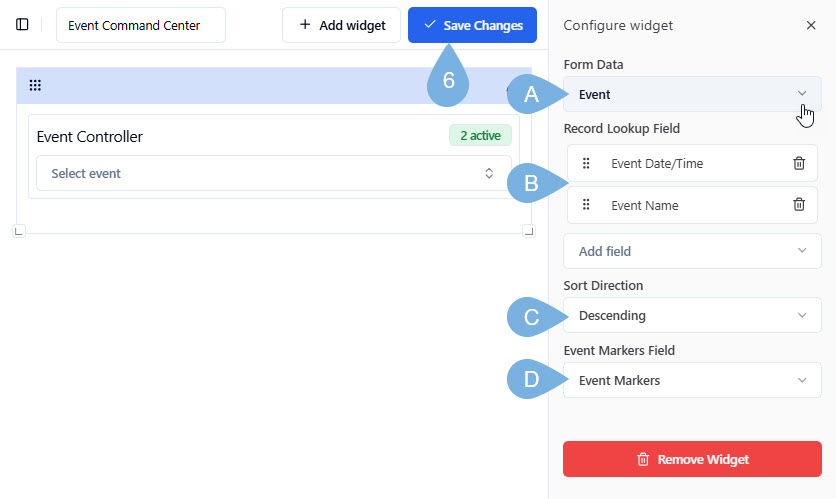
Configure the new Event Controller by selecting the following →
- A. Form Data → pick Event
-
B. Record Lookup → pick Event Date/Time followed by Event Name
-
C. Sort Direction → choose Descending or Acending
-
D. Event Markers → select Event Markers
-
Click Save Changes
- Learn all about Managing Event Markers in our help artile by the same name!
Tips for dashboards & reports
-
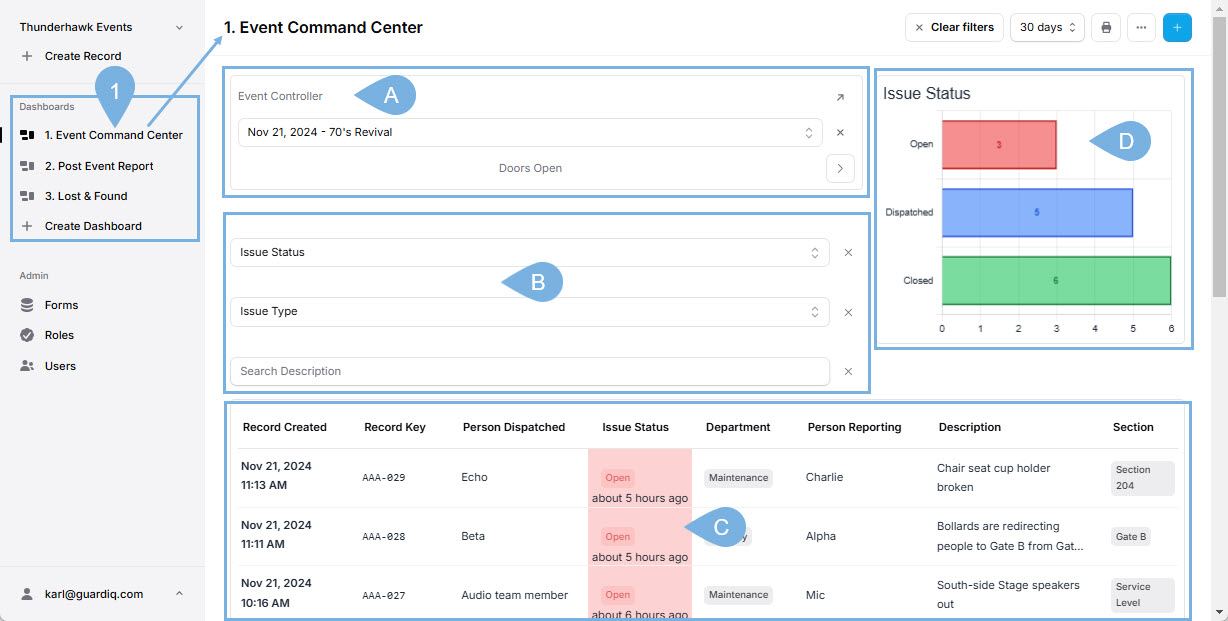
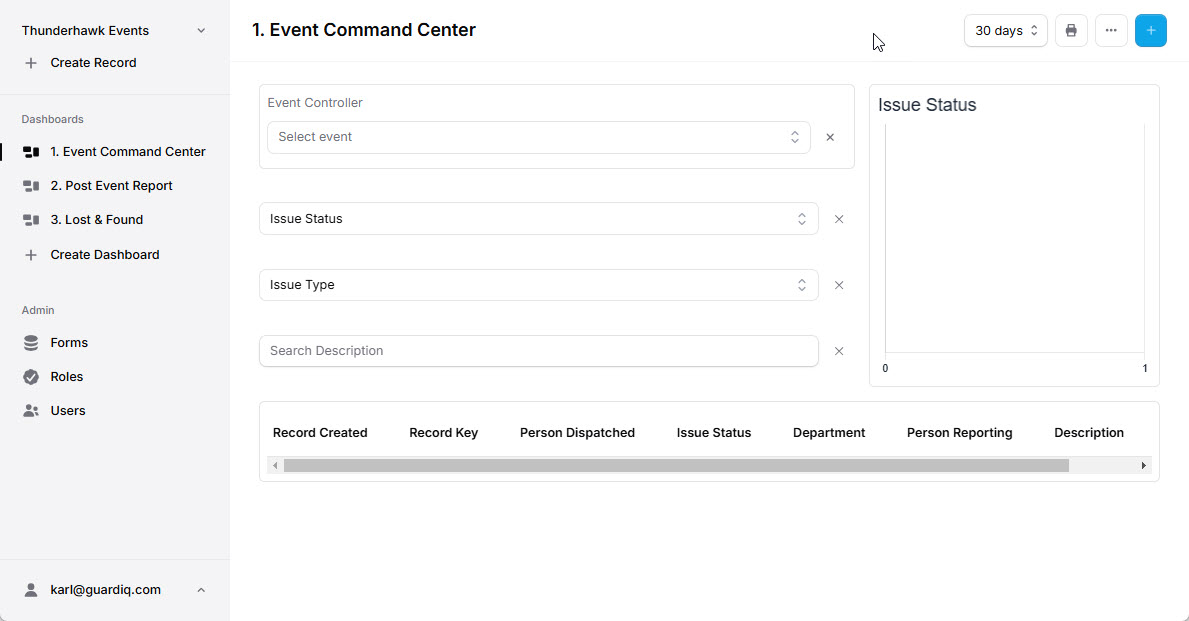
Start by deciding the information you need to see in your dashboard. Our sample includes:
- A. Event Controller → Select Events by Date and Name, and track progress with Event Markers
- B. Filters → to track progress or status, isolate issues, or search description fields
- One Text Field → Filter any Text Entry fields in your Records
- Two Select Field → Filter any drop-down selection choice made in your Records
- C. Records Table → Track any or all the entry types made for each record
- D. Bar Chart → Add Bar Charts to track any drop-down selection or Progress/Status Records