→ Edit, Configure & Share Dashboards
About Dashboards, Widgets & Filters
Dashboards are curated collections of Widgets designed to display events, track incidents, dispatch solutions, allocate resources, and deliver filtered post-event summaries and Reports.
Easily Edited, Configured and Shared, Dashboards are the nerve center of your operations.
-
Open your various Dashboards from the Navigation panel
-
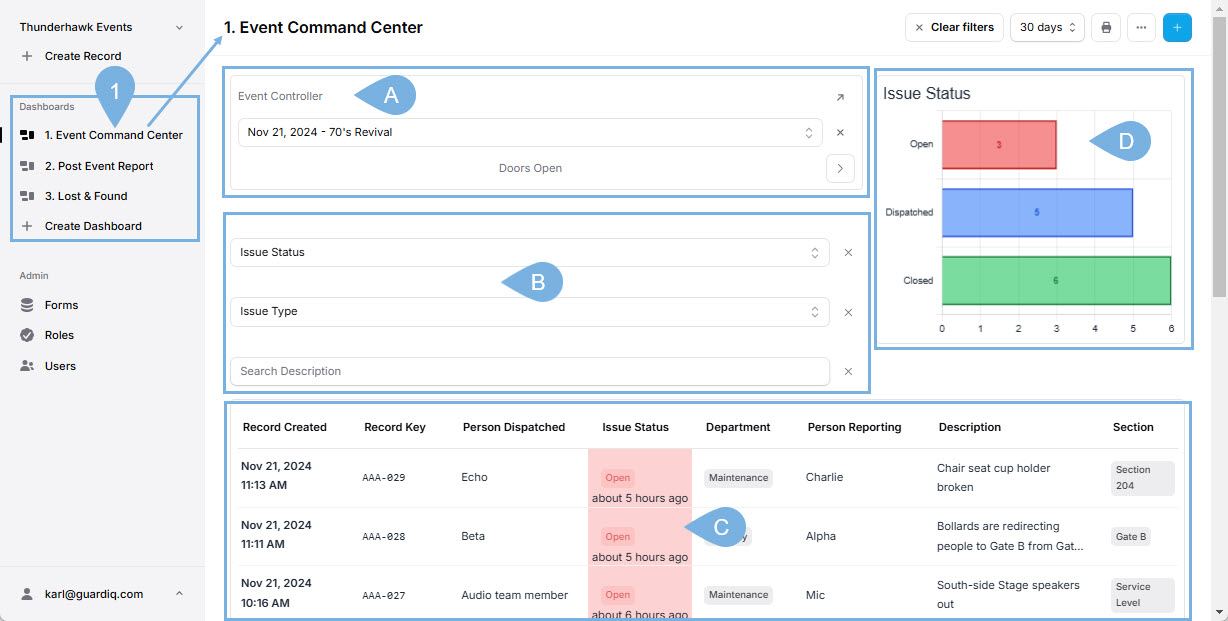
As marked above → segment and filter a Dashboard's Records with Widgets! For example:
A. Event Controller → sort Events by Name, Date, and Event Markers
B. Filters → filter by Issue Type, Status, Description, etc.
C. Records Table → segment by Time, persons Dispatched, Progress, Location, Department, etc.
D. Charts → track progress with Charts and Graphs
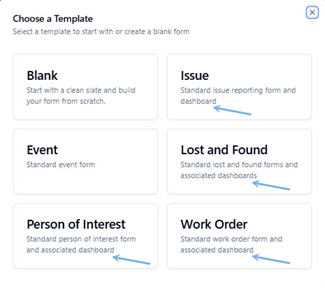
About Dashboard TemplatesTemplates have been added to Guard IQ to help you create Forms. As you do so, 2/3 of the templates also create sample Dashboards (while others create widgets like the Event Controller).
If this is your first experience with Dashboards, starting with a template might not be a bad idea! Over time you can Edit and customize the Dashboard to tightly fit your needs.
Edit Dashboards
If see the ellipsis ( ... ) → your organization has given you the required Role Definitions to access a Dashboard's Editing options:

Rename Dashboards & Reports
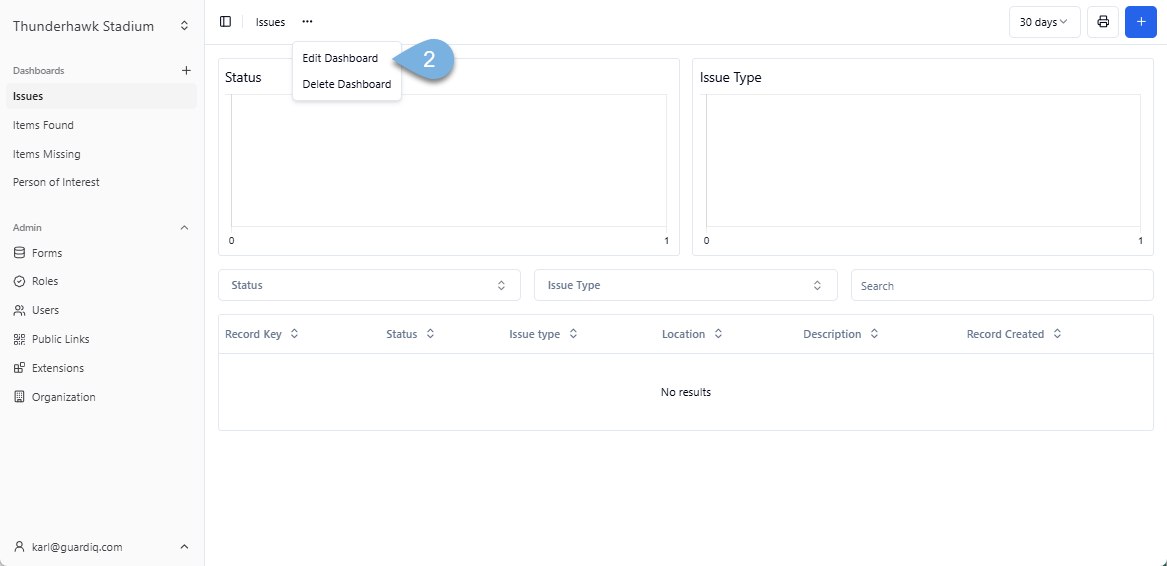
To rename a Dashboard and its affiliated Report:
-
Open your Dashboard → ex Issue
-
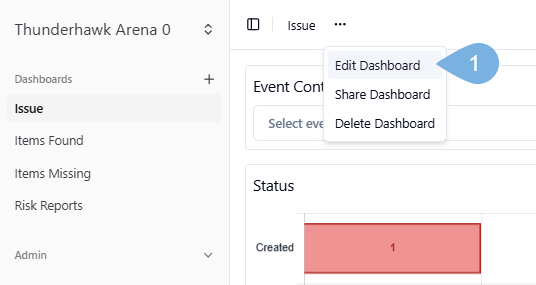
Click the Dashboard's editing ellipsis → ( . . . )
-
Pick Edit Dashboard

-
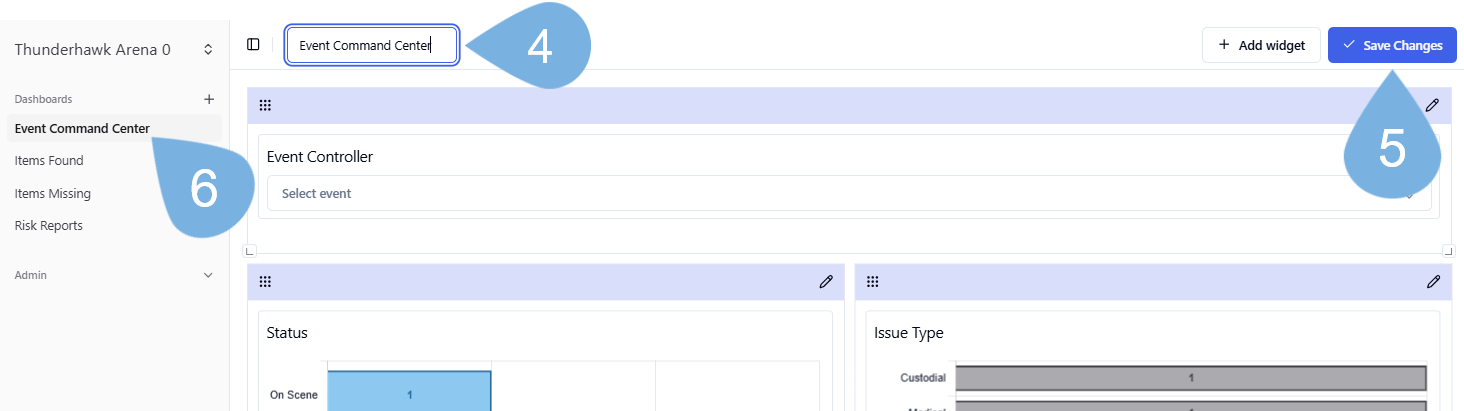
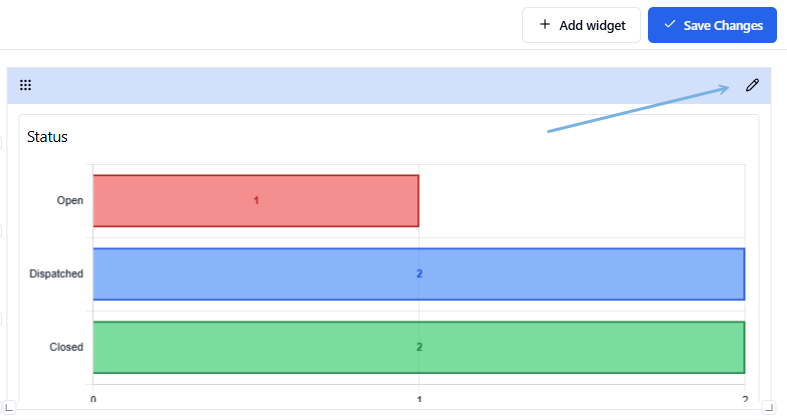
Rename the Dashboard → ex. Event Command Center
-
Click ✓ Save Changes
-
Blink → and the new name will appear in the Navigation bar
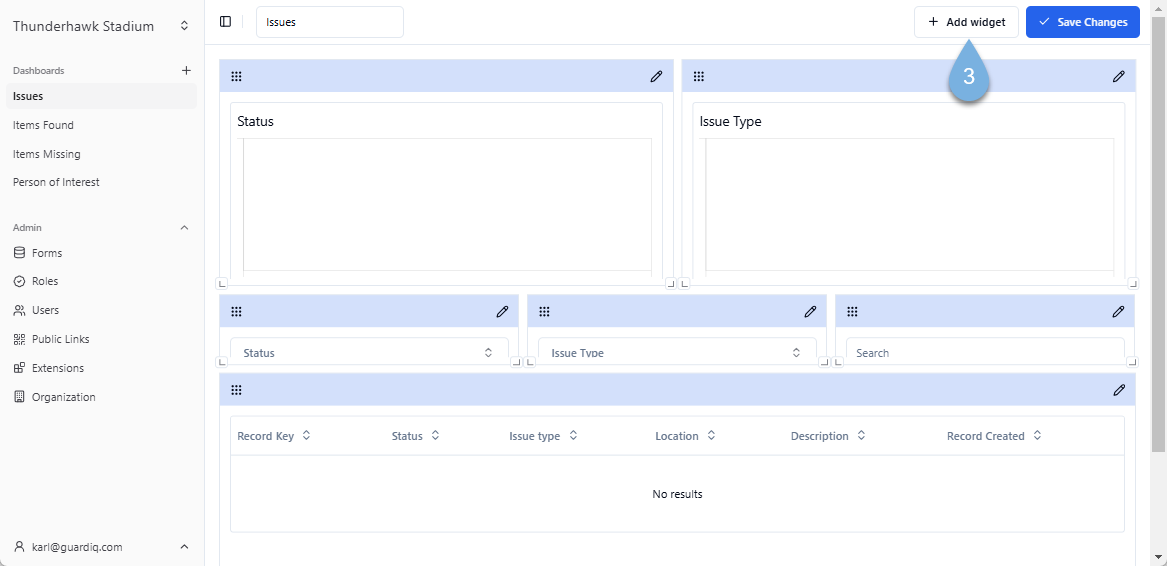
Snag, Drag & Size your Widgets
To add Widgets to a Dashboard:
-
Open a Dashboard → click the Ellipsis menu → and pick Edit Dashboard
-
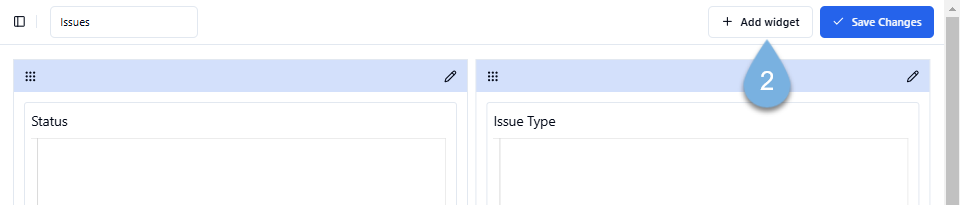
Click + Add widget
-
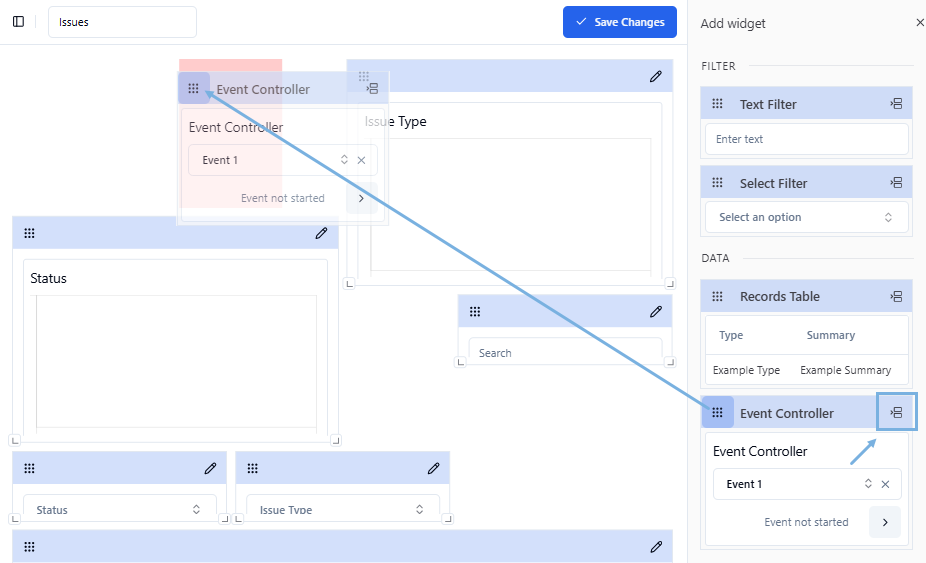
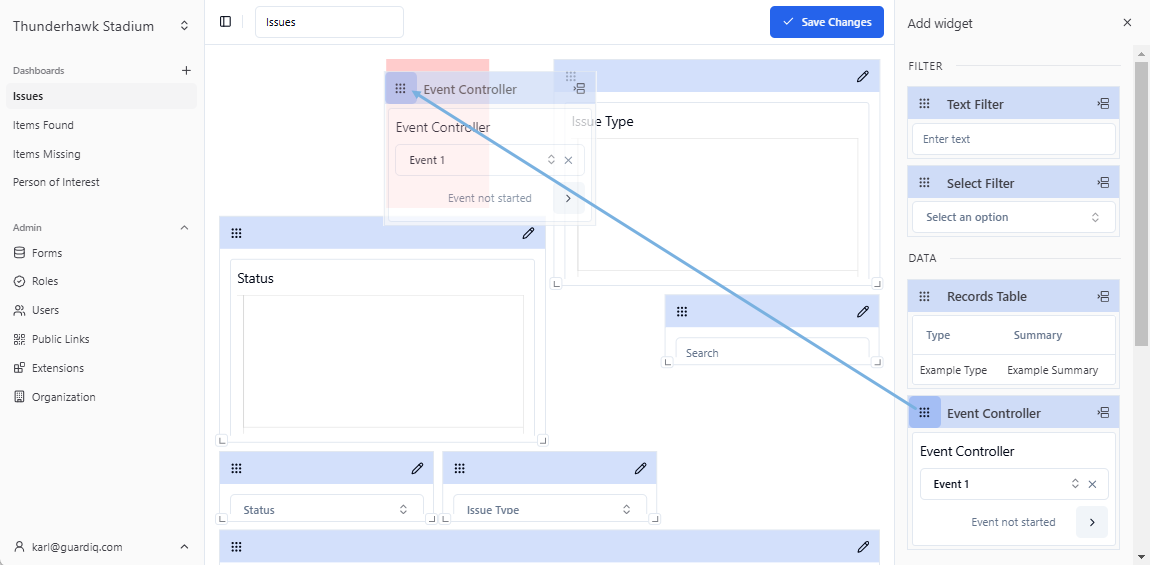
Snag and drag your Widget to the Dashboard → or tap the Quick Drop icon to pop in a Widget → then glide it into position by its 'waffle' handle
-
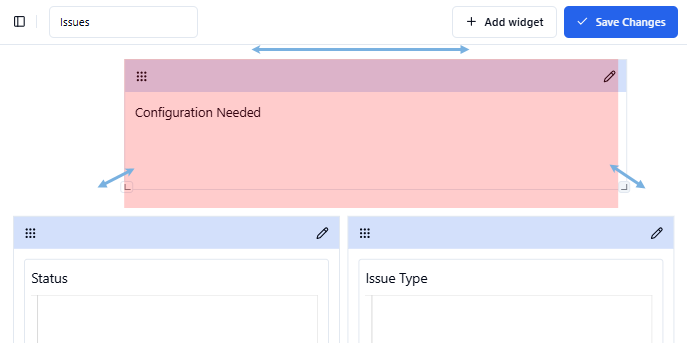
Position the Widget by dragging its top-bar handle
-
Drag the sizing handles in and out to resize the Widget
-
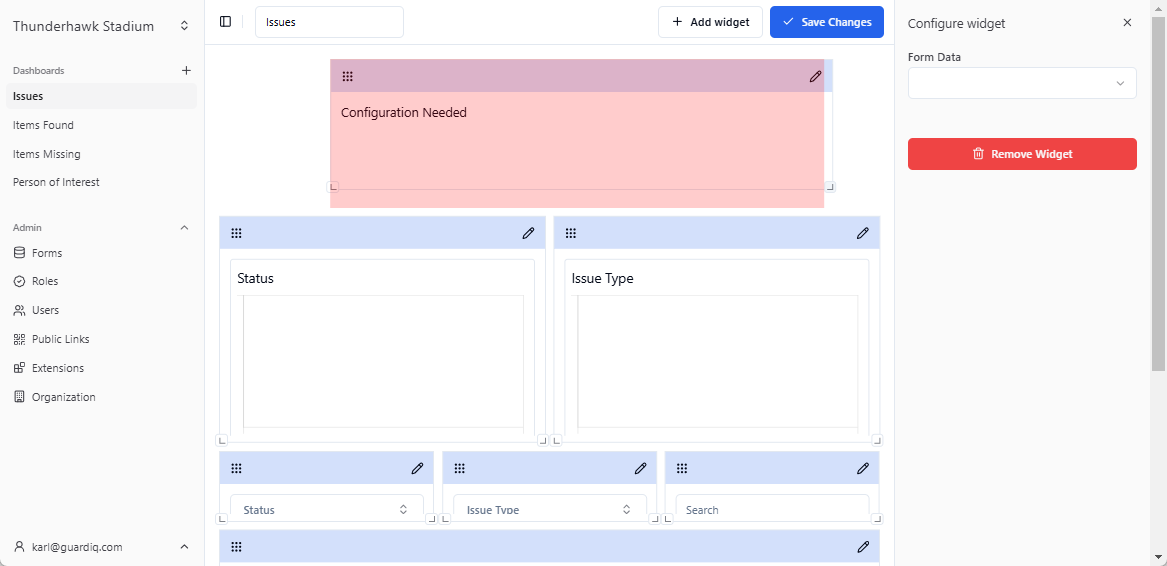
Configure your Widget as needed. (This will take further explanation)
-
Click ✓ Save Changes
Delete or Remove Widgets
To Edit the configuration of a Widget, or to remove it altogether:
-
Select the Edit icon → make your updates → and click ✓ Save Changes
-
Click Remove Widget
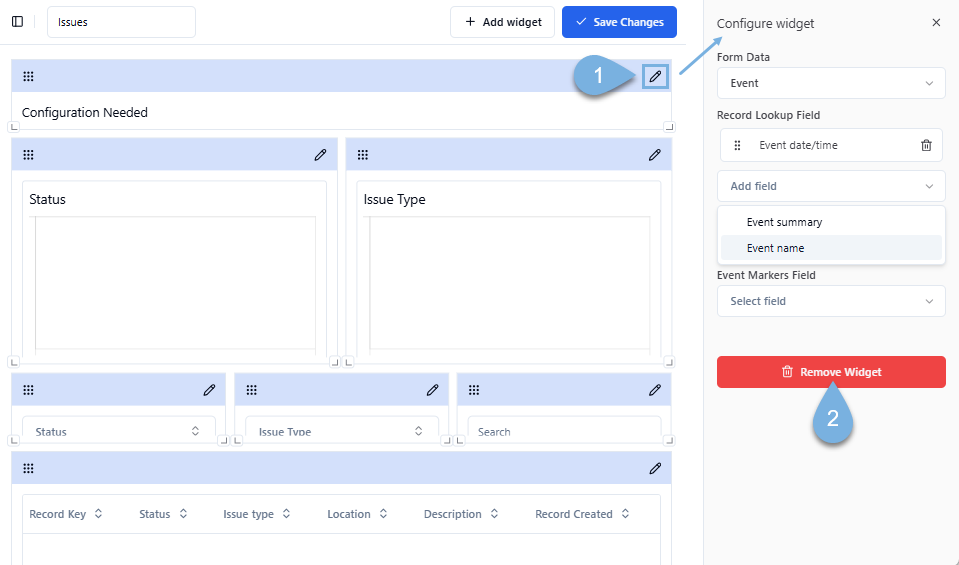
-
Confirm the deletion → by tapping Remove

Configure Widgets!
Every Widget must be configured. And, each Widget Type requires a slightly different set of choices.
When configuring a Widget you will:
- Name the Widget → Chart Title_ → ex. Status
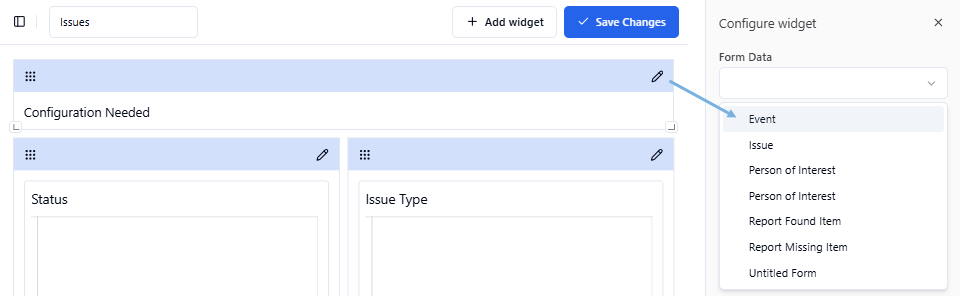
- Link the Widget to a Form's Data → ex. Issue
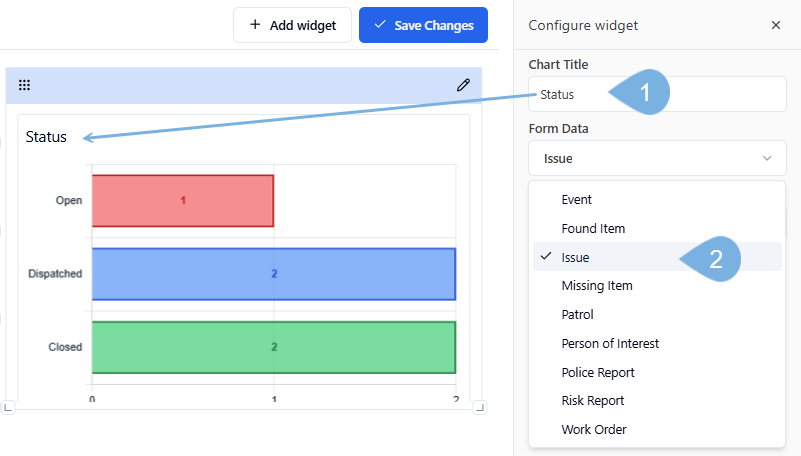
-
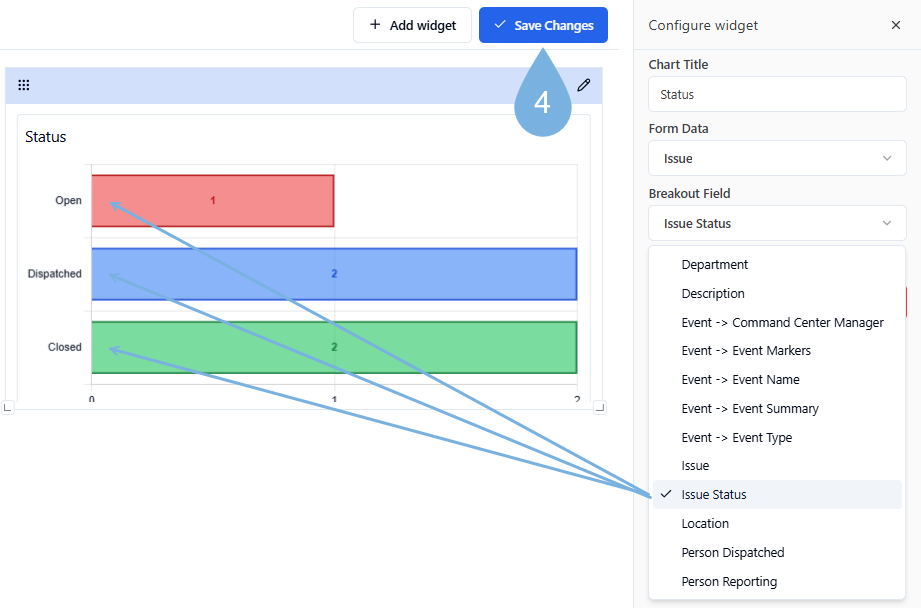
Delineate the Field from the Form you wish to display and segment → ex. Issue Status
-
Click ✓ Save Changes
Re-configure Existing Widgets
To edit Widgets already found on a Dashboard:
-
Open a Dashboard → click the Ellipsis menu → and pick Edit Dashboard
-
Click any editing Pencil icon
-
Snag and drag your Widget to the Dashboard → or tap the Quick Drop icon to pop in a Widget → then glide it into position by its 'waffle' handle
-
Position the Widget by dragging its top-bar handle
-
Drag the sizing handles in and out to resize the Widget
-
Configure your Widget as needed. (This will take further explanation)
-
Click ✓ Save Changes
All Widget Types & Their Configurations
The Add Widgets panel is divided into three sections → Filter, Data and Chart.
Link to sample configurations from this list:
-
FILTER
- Text Filter → Filter the Text Entry fields in your Records
- Select Filter → Filter by any drop-down selection made in your Records

-
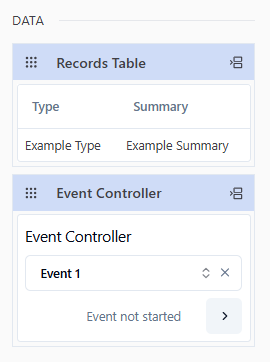
DATA
- Records Table → Track any or all of the entry types made for each reacord
- Event Controller → Select Events by Date and Name, and track progress with Event Markers
-
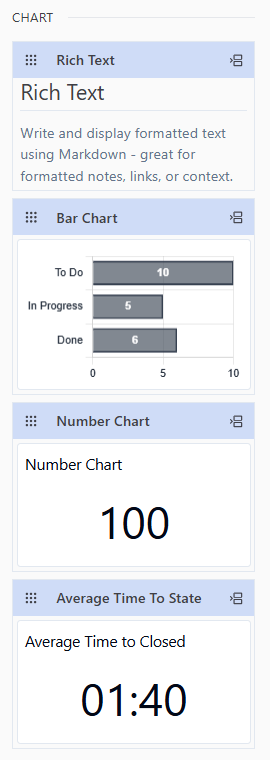
CHART
- Rich Text → Insert instructions or static text into Dashboards
- Bar Chart → Charts and track any drop-down selection and status updates
- Number Chart → Aggrigate the number of occurances
- Average Time to State → Track the time it takes to resolve open issues
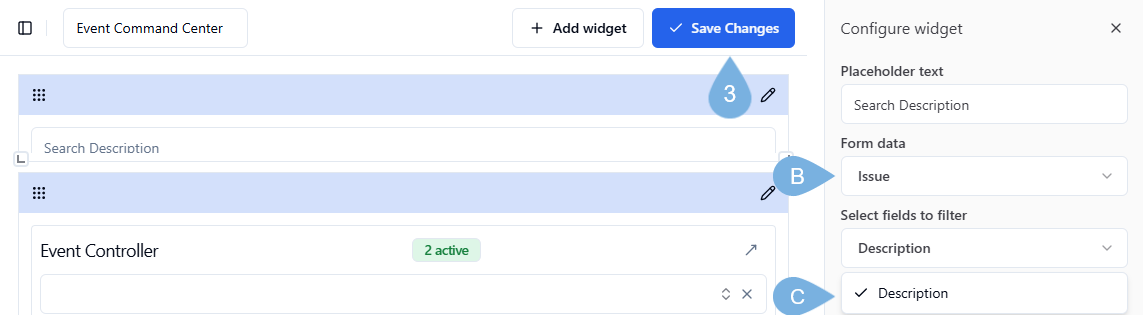
Configuring a Text Field "filtering" Widget
Let's start with an easy one → a Text Filter.
-
Select the Edit icon
-
Configure your Widget
-
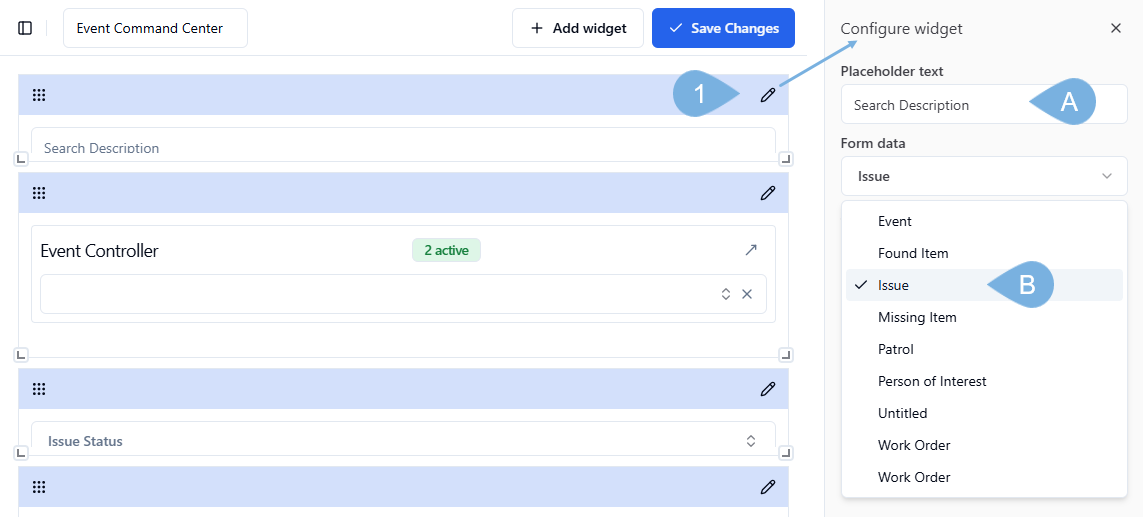
A. Enter your Placeholder text → ex. Search descriptions
-
B. Link your Text filter Widget to a Form → ex. Issue
-
C. Select which Text Field you want to filter → ex. Description
-
-
Click ✓ Save Changes
Share Dashboards
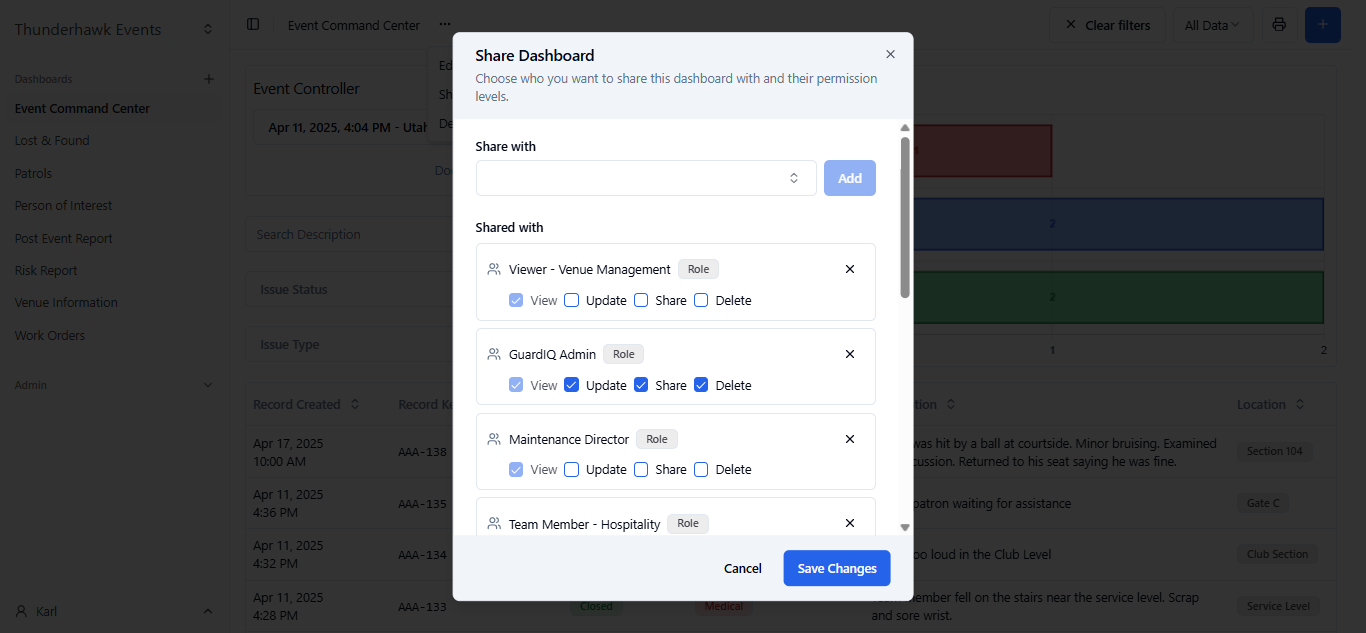
Share your Dashboards with everyone and anyone . . . no, wait. Share Dashboards with advanced (granular) sharing restrictions.
There are many reasons to Share Dashboards. However, you may want to restrict Sharing to specific people and groups based on roles or names, for a couple of reasons:
-
- Some Records may be confidential. For example, the Security or Risk Teams may wish to shield their Dashboards from the Hospitality or Maintenance staff.
Other teams simply may be inundated with records from other teams that do not directly concern them! For example, the Guest Services team does not want to weed through all of the Patrol or Maintence Dashboards, and vice versa.
In this example, Guest Services Team Members:
Can see all upcoming Events (Past, Present, & Future) Can only view Issue Records that come in for the Guest Services and related teams to act on Can't see Records meant for any other department → ex. Security or Patrol Roles To restrict a Role beyond the basic settings:
-
Open a Dashboard → click the Ellipsis menu → and pick Share Dashboard
-
Tap the Edit button on any Role you wish to further restrict → ex. Team member - Custodial Roles
Open the Gear icon → appearing next to the User permission you wish to restrict
Roles 888
Click Add Restrictions
Roles
Pick the Form that you want to restrict → ex. Event or Issues
Roles
Click the various permissions:
A. Events → Give access to all events by selecting Show all records. B. Issues → Limit access to Hospitality issues by clicking Show records where C. Pick the Hospitality department from the list D. Click Done Roles
Click Save Changes (And Don't Forget!!!)
Using Dashboard Templates
Templates simultaneously create Forms and the coresponding Dashboards.
If you are new to Templates see →
- Issue Template & Dashboard → Create an Issue Form and a Dashboard with 3 related Widgets
- Event Template & Event Controller → Create an Event Controller Widget to use on any Dashboard
:::
Convert an Issue Template into an Event Command Center
Using Guard IQ templates?
If you used the Issue Template, your Event Command Center is almost ready. Simply merge your Event Controller template with your Issue Form and Dashboard.
To build an Event Command Center dashboard from the Issue Template:
-
Open your Issue Dashboard
-
Click the Ellipsis menu → and pick Edit Dashboard
-
Click + Add widget
-
Snag and drag the Event Controller widget to the top of the Dashboard → or click the quick add shortcut icon
-
Position the Event Controller near the top of the Dashboard -- drag the markers to make it wider or narrow -- grab the header to move it around
-
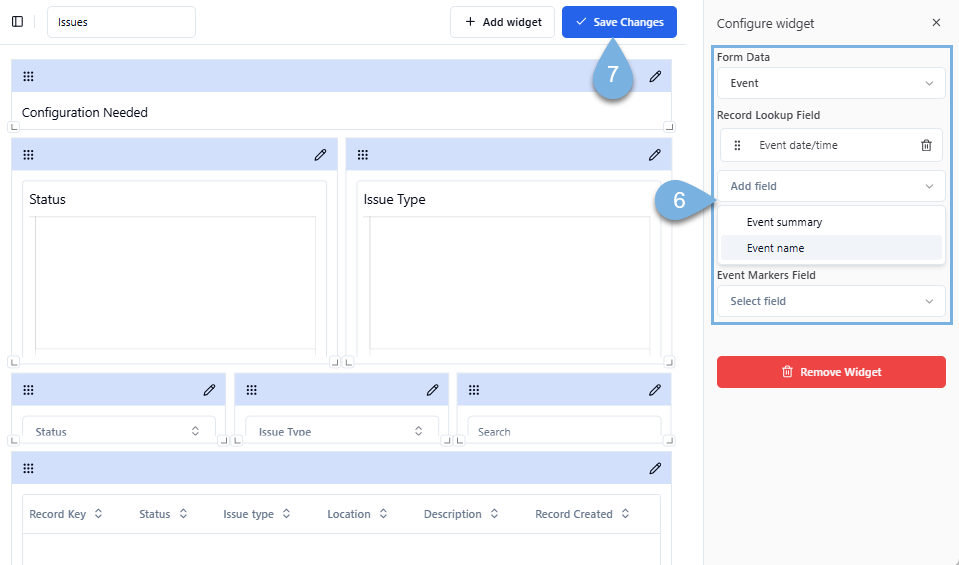
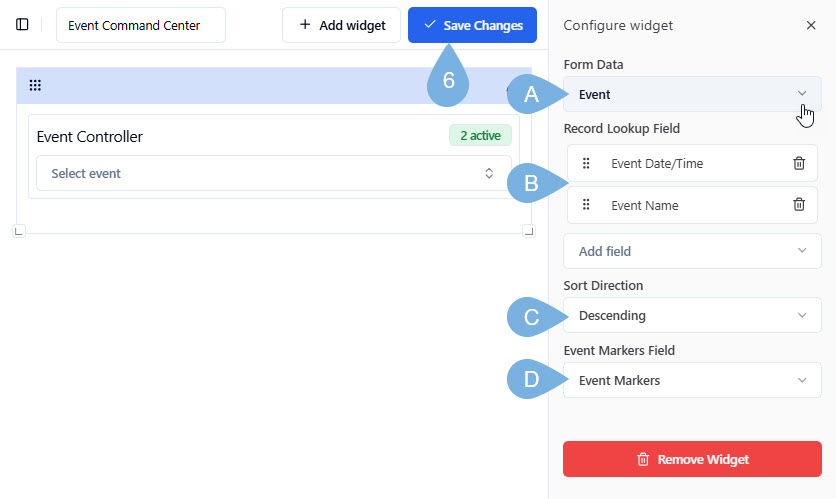
Configure the new Event Controller by selecting the following →
- A. Form Data → pick Event
-
B. Record Lookup → pick Event Date/Time followed by Event Name
-
C. Sort Direction → choose Descending or Acending
-
D. Event Markers → select Event Markers
-
Click Save Changes
- Learn all about Managing Event Markers in our help artile by the same name!
Tips for dashboards & reports
-
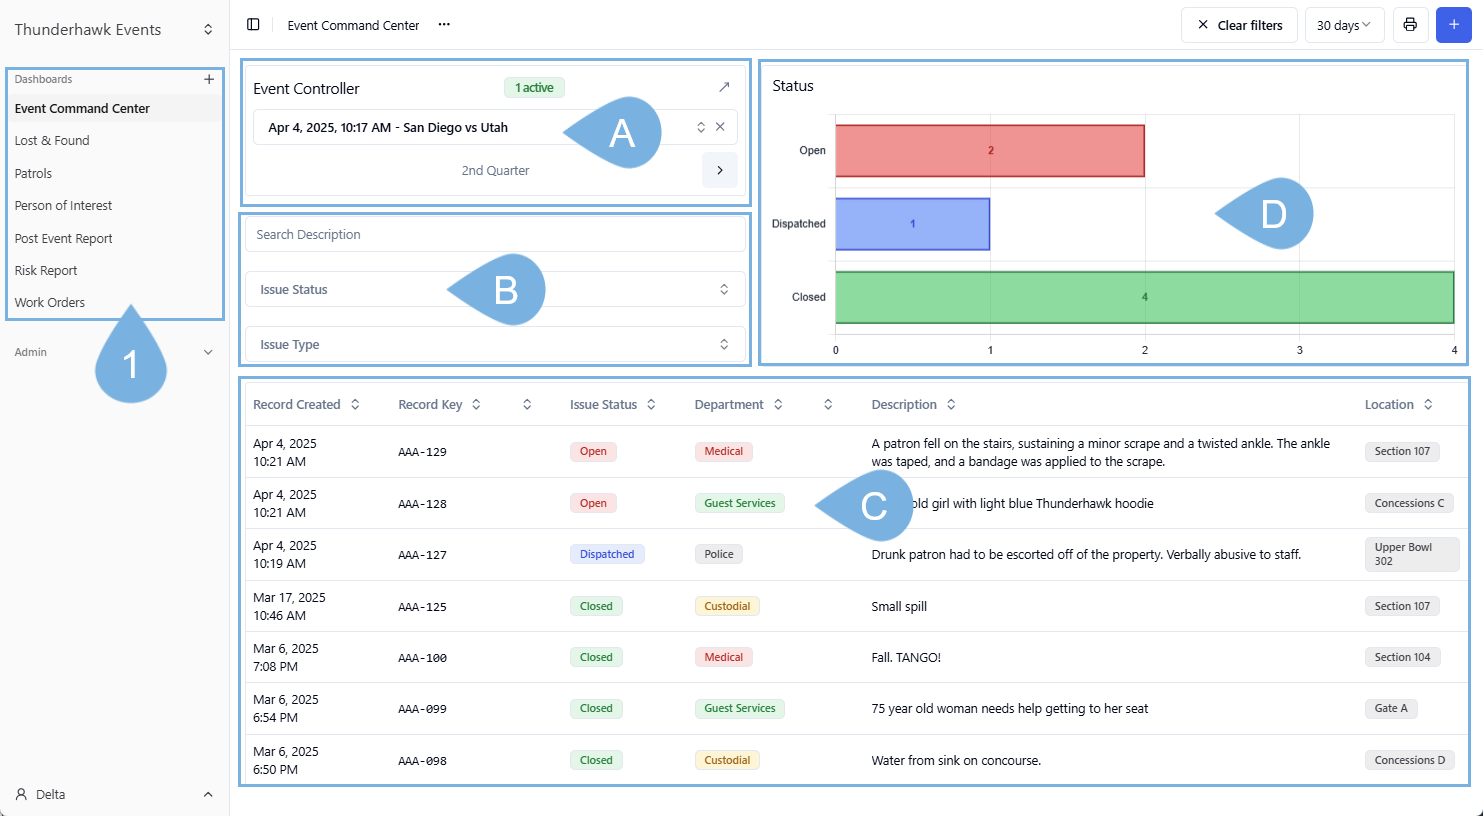
Start by deciding the information you need to see in your dashboard. Our sample includes:
- A. Event Controller → Select Events by Date and Name, and track progress with Event Markers
- B. Filters → to track progress or status, isolate issues, or search description fields
- One Text Field → Filter any Text Entry fields in your Records
- Two Select Field → Filter any drop-down selection choice made in your Records
- C. Records Table → Track any or all the entry types made for each record
- D. Bar Chart → Add Bar Charts to track any drop-down selection or Progress/Status Records